QUESTION IMAGE
Question
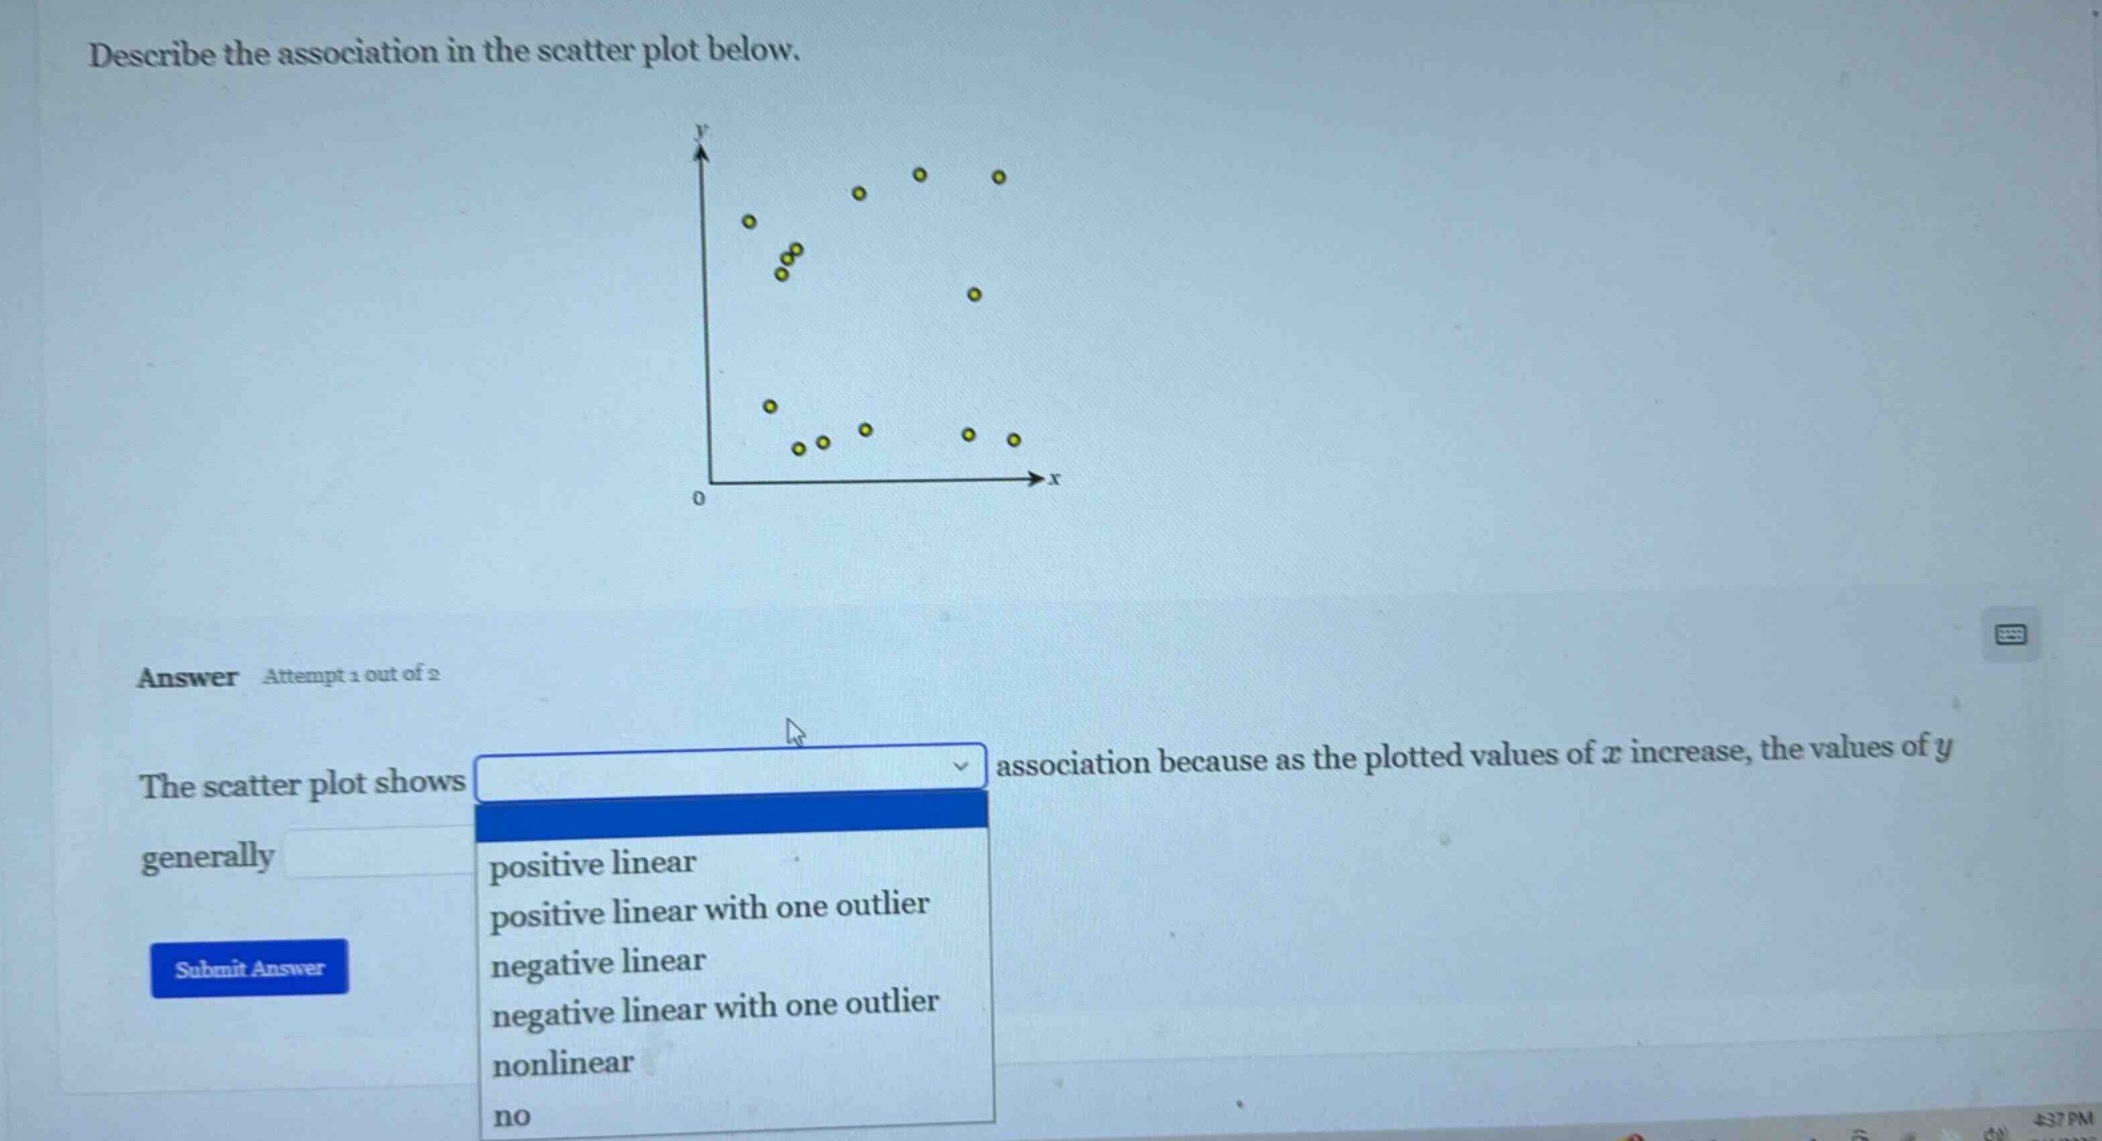
describe the association in the scatter plot below.
answer attempt 1 out of 2
the scatter plot shows association because as the plotted values of ( x ) increase, the values of ( y ) generally
options: positive linear, positive linear with one outlier, negative linear, negative linear with one outlier, nonlinear, no
Brief Explanations
The scatter plot's points do not follow a straight line pattern; instead, they form a curved, clustered shape where y-values do not increase or decrease linearly with x-values, indicating a nonlinear association.

Snap & solve any problem in the app
Get step-by-step solutions on Sovi AI
Photo-based solutions with guided steps
Explore more problems and detailed explanations
nonlinear