QUESTION IMAGE
Question
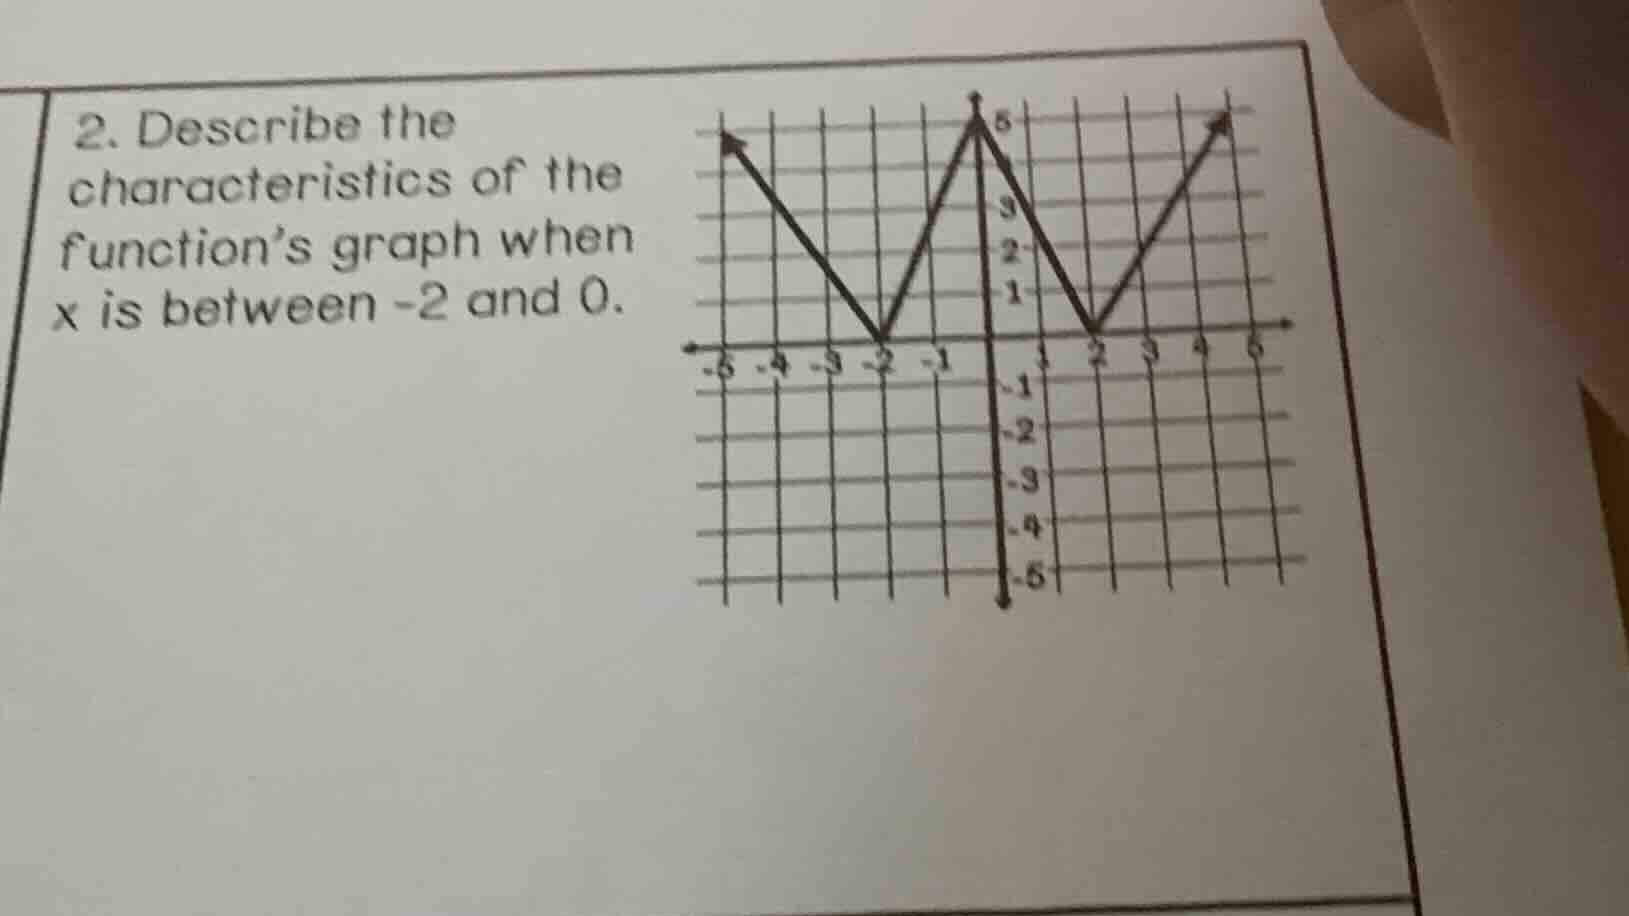
- describe the characteristics of the function’s graph when x is between -2 and 0.
Brief Explanations
- First, identify the interval $x \in (-2, 0)$ on the x-axis.
- Observe the line segment connecting the points $(-2, 0)$ and $(0, 5)$:
- As $x$ increases from -2 to 0, the y-values rise from 0 to 5, so the function is increasing here.
- The segment is a straight line, meaning it is a linear portion of the piecewise function.
- The slope of this segment is positive, calculated as $\frac{5-0}{0-(-2)} = \frac{5}{2}$.
- The range of y-values in this interval is from 0 to 5.

Snap & solve any problem in the app
Get step-by-step solutions on Sovi AI
Photo-based solutions with guided steps
Explore more problems and detailed explanations
When $x$ is between -2 and 0, the graph is a straight, upward-sloping (increasing) line segment. As $x$ increases from -2 to 0, the function's output increases from 0 to 5, with a constant positive slope of $\frac{5}{2}$.