QUESTION IMAGE
Question
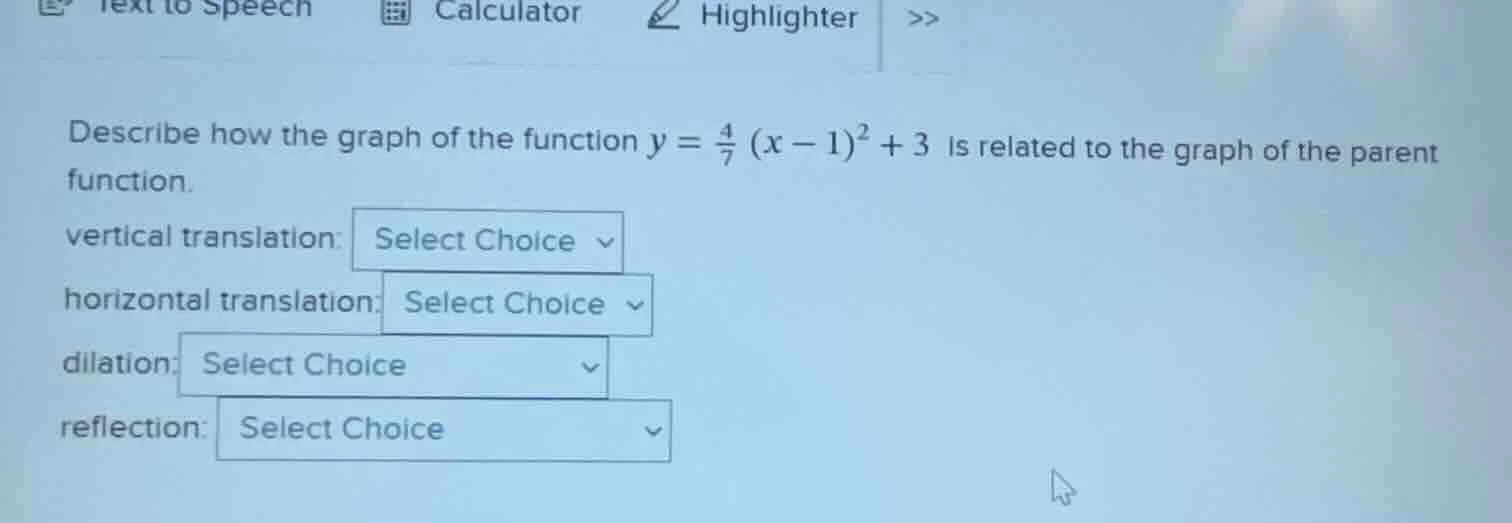
describe how the graph of the function $y = \frac{4}{7} (x - 1)^2 + 3$ is related to the graph of the parent function.
vertical translation: select choice
horizontal translation: select choice
dilation: select choice
reflection: select choice
Step1: Identify parent function
The parent function is $y=x^2$.
Step2: Analyze vertical translation
Look at the constant term $+3$. For $y=a(x-h)^2+k$, $k>0$ means up shift.
Vertical translation: 3 units up
Step3: Analyze horizontal translation
Look at $(x-1)$. For $y=a(x-h)^2+k$, $h>0$ means right shift.
Horizontal translation: 1 unit right
Step4: Analyze dilation
Look at the coefficient $\frac{4}{7}$. Since $0<|a|<1$, it's a vertical compression.
Dilation: Vertical compression by factor $\frac{4}{7}$
Step5: Analyze reflection
The coefficient $\frac{4}{7}$ is positive, so no reflection over x-axis.
Reflection: No reflection

Snap & solve any problem in the app
Get step-by-step solutions on Sovi AI
Photo-based solutions with guided steps
Explore more problems and detailed explanations
vertical translation: 3 units up
horizontal translation: 1 unit right
dilation: Vertical compression by a factor of $\frac{4}{7}$
reflection: No reflection across the x-axis