QUESTION IMAGE
Question
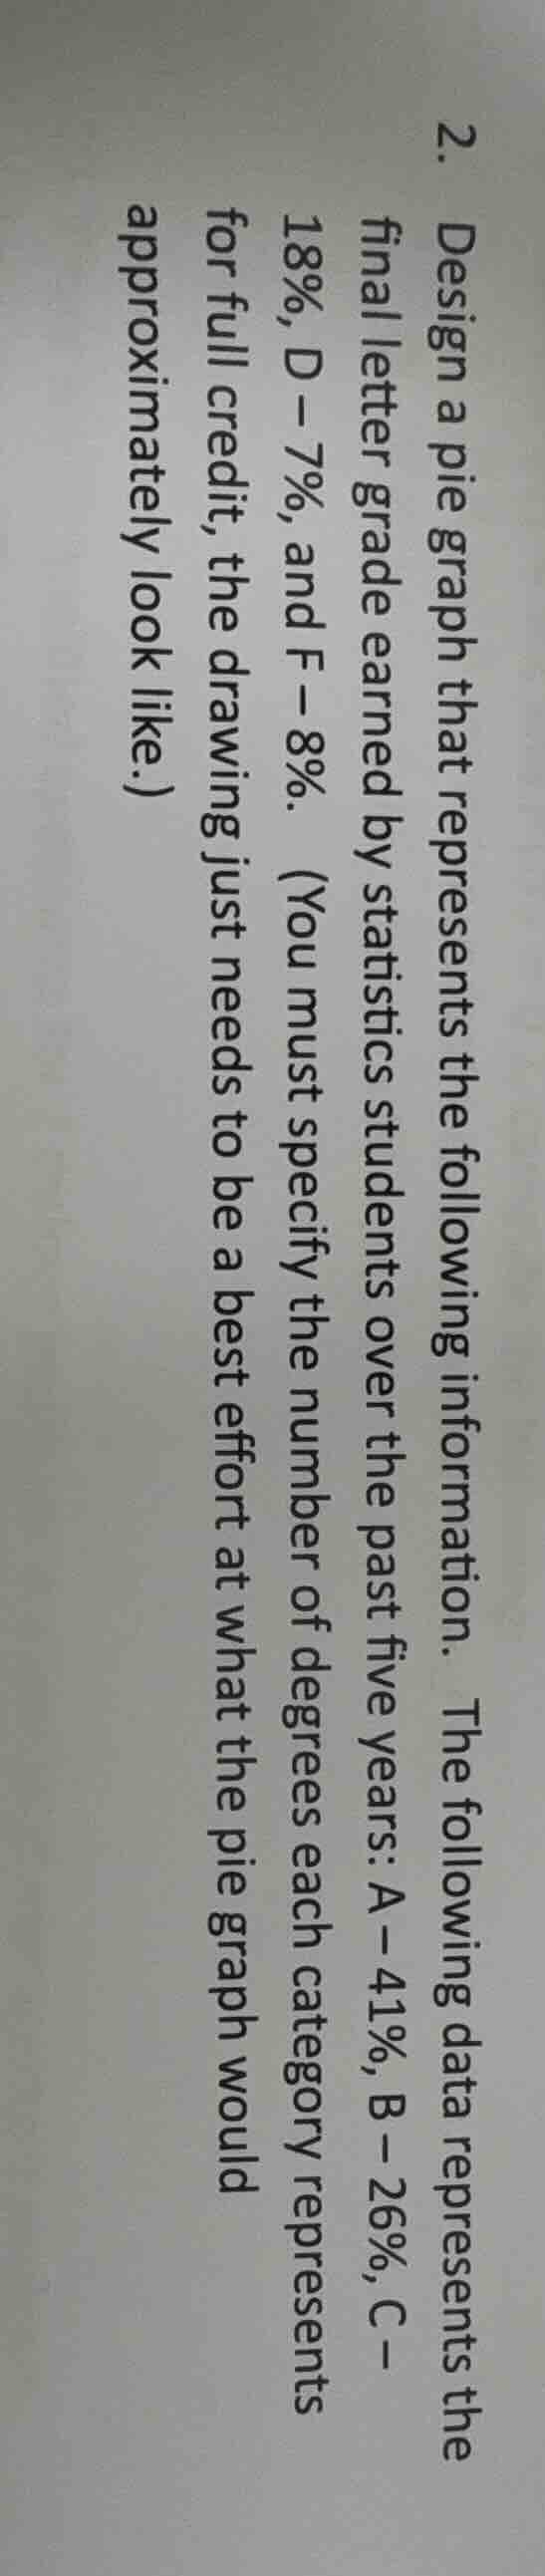
- design a pie graph that represents the following information. the following data represents the final letter grade earned by statistics students over the past five years: a – 41%, b – 26%, c – 18%, d – 7%, and f – 8%. (you must specify the number of degrees each category represents for full credit, the drawing just needs to be a best effort at what the pie graph would approximately look like.)
Step1: Calculate degrees for A
A full circle is $360^\circ$. Multiply percentage by $360^\circ$:
$41\% \times 360^\circ = 0.41 \times 360^\circ = 147.6^\circ$
Step2: Calculate degrees for B
Multiply B's percentage by $360^\circ$:
$26\% \times 360^\circ = 0.26 \times 360^\circ = 93.6^\circ$
Step3: Calculate degrees for C
Multiply C's percentage by $360^\circ$:
$18\% \times 360^\circ = 0.18 \times 360^\circ = 64.8^\circ$
Step4: Calculate degrees for D
Multiply D's percentage by $360^\circ$:
$7\% \times 360^\circ = 0.07 \times 360^\circ = 25.2^\circ$
Step5: Calculate degrees for F
Multiply F's percentage by $360^\circ$:
$8\% \times 360^\circ = 0.08 \times 360^\circ = 28.8^\circ$
Step6: Verify total degrees
Sum all calculated angles:
$147.6^\circ + 93.6^\circ + 64.8^\circ + 25.2^\circ + 28.8^\circ = 360^\circ$

Snap & solve any problem in the app
Get step-by-step solutions on Sovi AI
Photo-based solutions with guided steps
Explore more problems and detailed explanations
| Grade | Percentage | Degrees in Pie Graph |
|---|---|---|
| B | 26% | $93.6^\circ$ |
| C | 18% | $64.8^\circ$ |
| D | 7% | $25.2^\circ$ |
| F | 8% | $28.8^\circ$ |
To draw the pie graph:
- Draw a full circle.
- Use a protractor to measure and mark each angle above for its corresponding grade, dividing the circle into 5 slices.
- Label each slice with its grade and percentage.