QUESTION IMAGE
Question
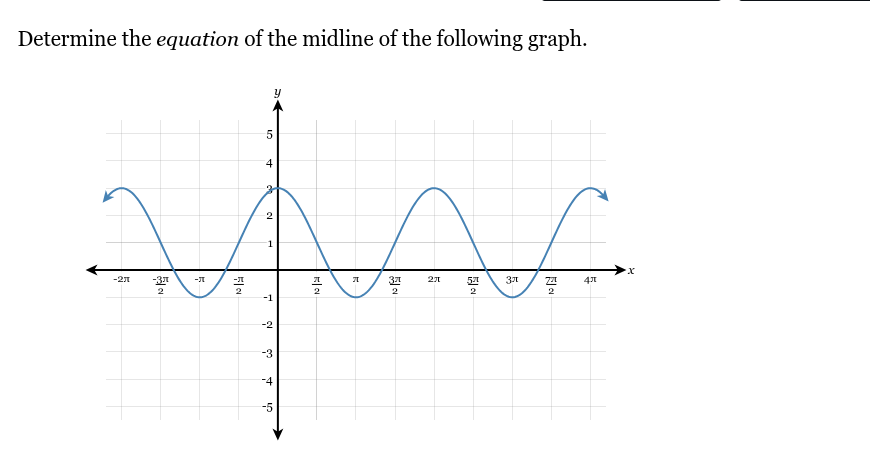
determine the equation of the midline of the following graph.
graph of a sinusoidal function with y-axis from -5 to 5 and x-axis from -2π to 4π, showing peaks at y=3 and troughs at y=-1
Step1: Identify max and min y-values
From the graph, the maximum y - value (peak) is \(y = 3\) and the minimum y - value (trough) is \(y=- 1\).
Step2: Calculate midline value
The midline of a sinusoidal graph is the horizontal line that is exactly halfway between the maximum and minimum values of the function. The formula for the midline \(y\) - coordinate is \(\frac{\text{max}+\text{min}}{2}\).
Substitute \(\text{max} = 3\) and \(\text{min}=-1\) into the formula: \(\frac{3 + (-1)}{2}=\frac{3 - 1}{2}=\frac{2}{2}=1\).
Step3: Determine the equation of the midline
Since the midline is a horizontal line, its equation is of the form \(y = k\), where \(k\) is the y - coordinate we calculated. So the equation of the midline is \(y = 1\).

Snap & solve any problem in the app
Get step-by-step solutions on Sovi AI
Photo-based solutions with guided steps
Explore more problems and detailed explanations
\(y = 1\)