QUESTION IMAGE
Question
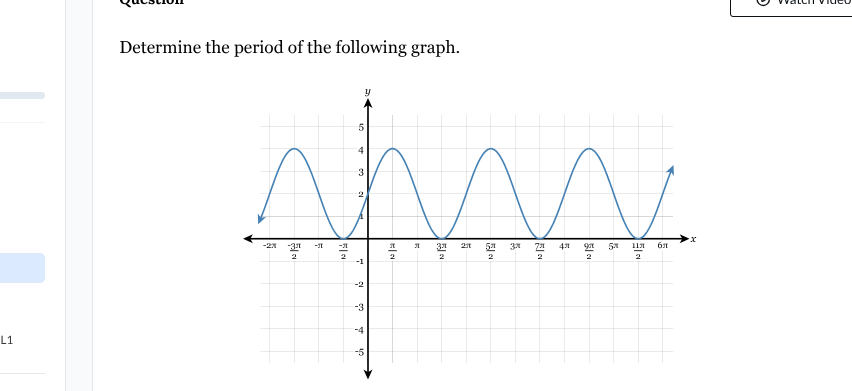
determine the period of the following graph.
Step1: Recall the definition of period
The period of a periodic function is the horizontal distance between two consecutive corresponding points on the graph (e.g., two consecutive peaks or two consecutive troughs).
Step2: Identify two consecutive peaks or troughs
Looking at the graph, let's take two consecutive troughs. For example, one trough is at \( x = \frac{3\pi}{2} \) and the next trough is at \( x=\frac{3\pi}{2}+2\pi=\frac{7\pi}{2} \)? Wait, no, looking at the x - axis labels, let's check the distance between two consecutive identical points. Let's take the troughs: the first trough (after the left - most part) is at \( x=\frac{3\pi}{2} \), the next trough is at \( x = \frac{3\pi}{2}+2\pi=\frac{7\pi}{2} \)? Wait, no, looking at the grid, the distance between \( \frac{3\pi}{2} \) and \( \frac{7\pi}{2} \) is \( \frac{7\pi}{2}-\frac{3\pi}{2}=2\pi \)? Wait, no, maybe I made a mistake. Wait, let's look at the peaks. The first peak (after the origin - side) is at \( x = \frac{\pi}{2} \), the next peak is at \( x=\frac{\pi}{2}+2\pi=\frac{5\pi}{2} \)? Wait, no, looking at the graph, the distance between two consecutive peaks: let's check the x - coordinates. The peak at \( x=\frac{\pi}{2} \), then the next peak at \( x=\frac{\pi}{2}+2\pi=\frac{5\pi}{2} \)? Wait, no, the horizontal distance between \( \frac{\pi}{2} \) and \( \frac{5\pi}{2} \) is \( \frac{5\pi}{2}-\frac{\pi}{2}=2\pi \)? Wait, no, looking at the grid lines, the distance between \( \frac{3\pi}{2} \) and \( \frac{7\pi}{2} \) is \( 2\pi \), but actually, let's check the distance between two consecutive troughs. The trough at \( x = \frac{3\pi}{2} \) and the next trough at \( x=\frac{3\pi}{2}+2\pi=\frac{7\pi}{2} \)? Wait, no, the graph shows that the distance between \( \frac{3\pi}{2} \) and \( \frac{7\pi}{2} \) is \( 2\pi \), but actually, looking at the x - axis, the labels are \( - 2\pi,-\frac{3\pi}{2},-\pi,-\frac{\pi}{2},0,\frac{\pi}{2},\pi,\frac{3\pi}{2},2\pi,\frac{5\pi}{2},3\pi,\frac{7\pi}{2},4\pi,\frac{9\pi}{2},5\pi,\frac{11\pi}{2},6\pi \). Wait, the distance between \( \frac{3\pi}{2} \) and \( \frac{7\pi}{2} \) is \( \frac{7\pi}{2}-\frac{3\pi}{2}=2\pi \). But actually, let's take two consecutive identical points. Let's take the troughs: the trough at \( x = \frac{3\pi}{2} \) and the trough at \( x=\frac{3\pi}{2}+2\pi=\frac{7\pi}{2} \), the difference is \( 2\pi \). Alternatively, take the peaks: peak at \( x=\frac{\pi}{2} \), peak at \( x=\frac{\pi}{2}+2\pi=\frac{5\pi}{2} \), difference is \( 2\pi \). Wait, but maybe I misread. Wait, the period of a sine or cosine - like function: the standard period of \( y = \sin x \) or \( y=\cos x \) is \( 2\pi \), but let's check the graph. Wait, the distance between \( \frac{3\pi}{2} \) and \( \frac{7\pi}{2} \) is \( 2\pi \), so the period is \( 2\pi \)? Wait, no, wait, let's check the distance between two consecutive troughs. The first trough (after the left - most) is at \( x=\frac{3\pi}{2} \), the next trough is at \( x=\frac{3\pi}{2}+2\pi=\frac{7\pi}{2} \), so the period \( T=\frac{7\pi}{2}-\frac{3\pi}{2}=2\pi \).
Wait, another way: the period is the length of one full cycle. Looking at the graph, from \( x = -\pi \) to \( x=\pi \), is that a cycle? No. Wait, from \( x = 0 \) to \( x = 2\pi \), is that a cycle? Wait, the graph repeats every \( 2\pi \) units. So the period is \( 2\pi \).
Wait, let's check the distance between two consecutive troughs. The trough at \( x=\frac{3\pi}{2} \) and the next trough at \( x=\frac{3\pi}{2}+2\pi=\frac{7\pi}{2} \), so the period \( T = 2\pi \).

Snap & solve any problem in the app
Get step-by-step solutions on Sovi AI
Photo-based solutions with guided steps
Explore more problems and detailed explanations
The period of the graph is \( 2\pi \)