QUESTION IMAGE
Question
determining slope and y-intercept
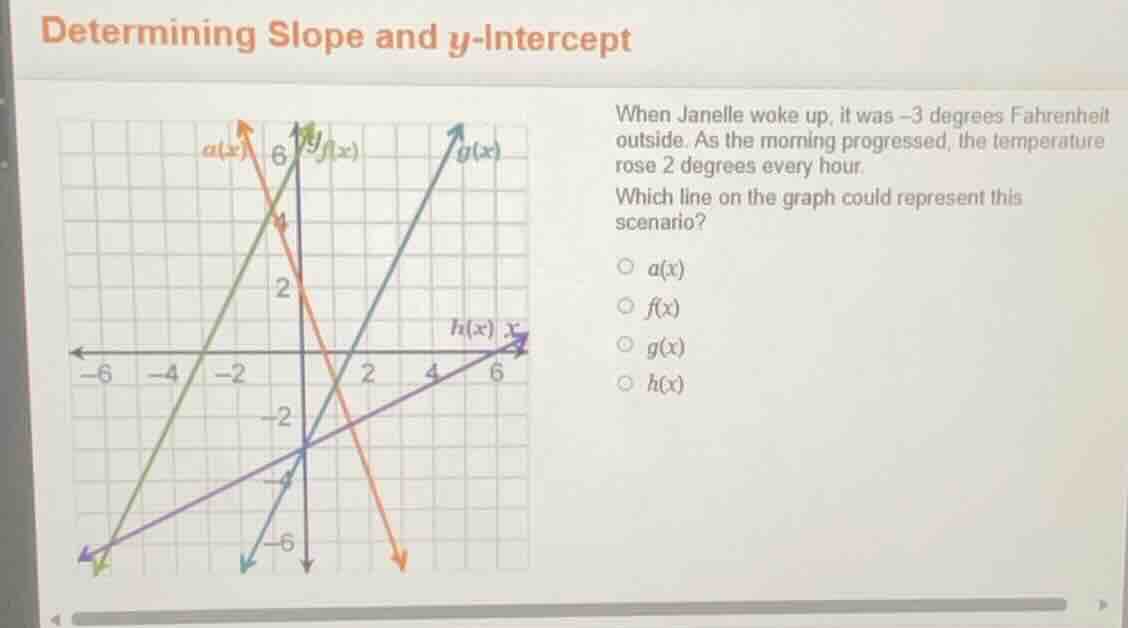
when janelle woke up, it was (-3) degrees fahrenheit outside. as the morning progressed, the temperature rose 2 degrees every hour.
which line on the graph could represent this scenario?
(a(x))
(f(x))
(g(x))
(h(x))
Step1: Define linear temperature model
The temperature scenario follows a linear function $y = mx + b$, where $m$ is the hourly temperature change (slope), and $b$ is the initial temperature (y-intercept).
Step2: Identify slope and intercept
Initial temperature $b = -3$, slope $m = 2$. The function is $y = 2x - 3$.
Step3: Match to graph lines
- $a(x)$: Negative slope (decreasing), eliminate.
- $f(x)$: Positive slope, y-intercept $+6$, eliminate.
- $g(x)$: Positive slope, y-intercept $-3$, matches $y=2x-3$.
- $h(x)$: Small positive slope, y-intercept $0$, eliminate.

Snap & solve any problem in the app
Get step-by-step solutions on Sovi AI
Photo-based solutions with guided steps
Explore more problems and detailed explanations
g(x)