QUESTION IMAGE
Question
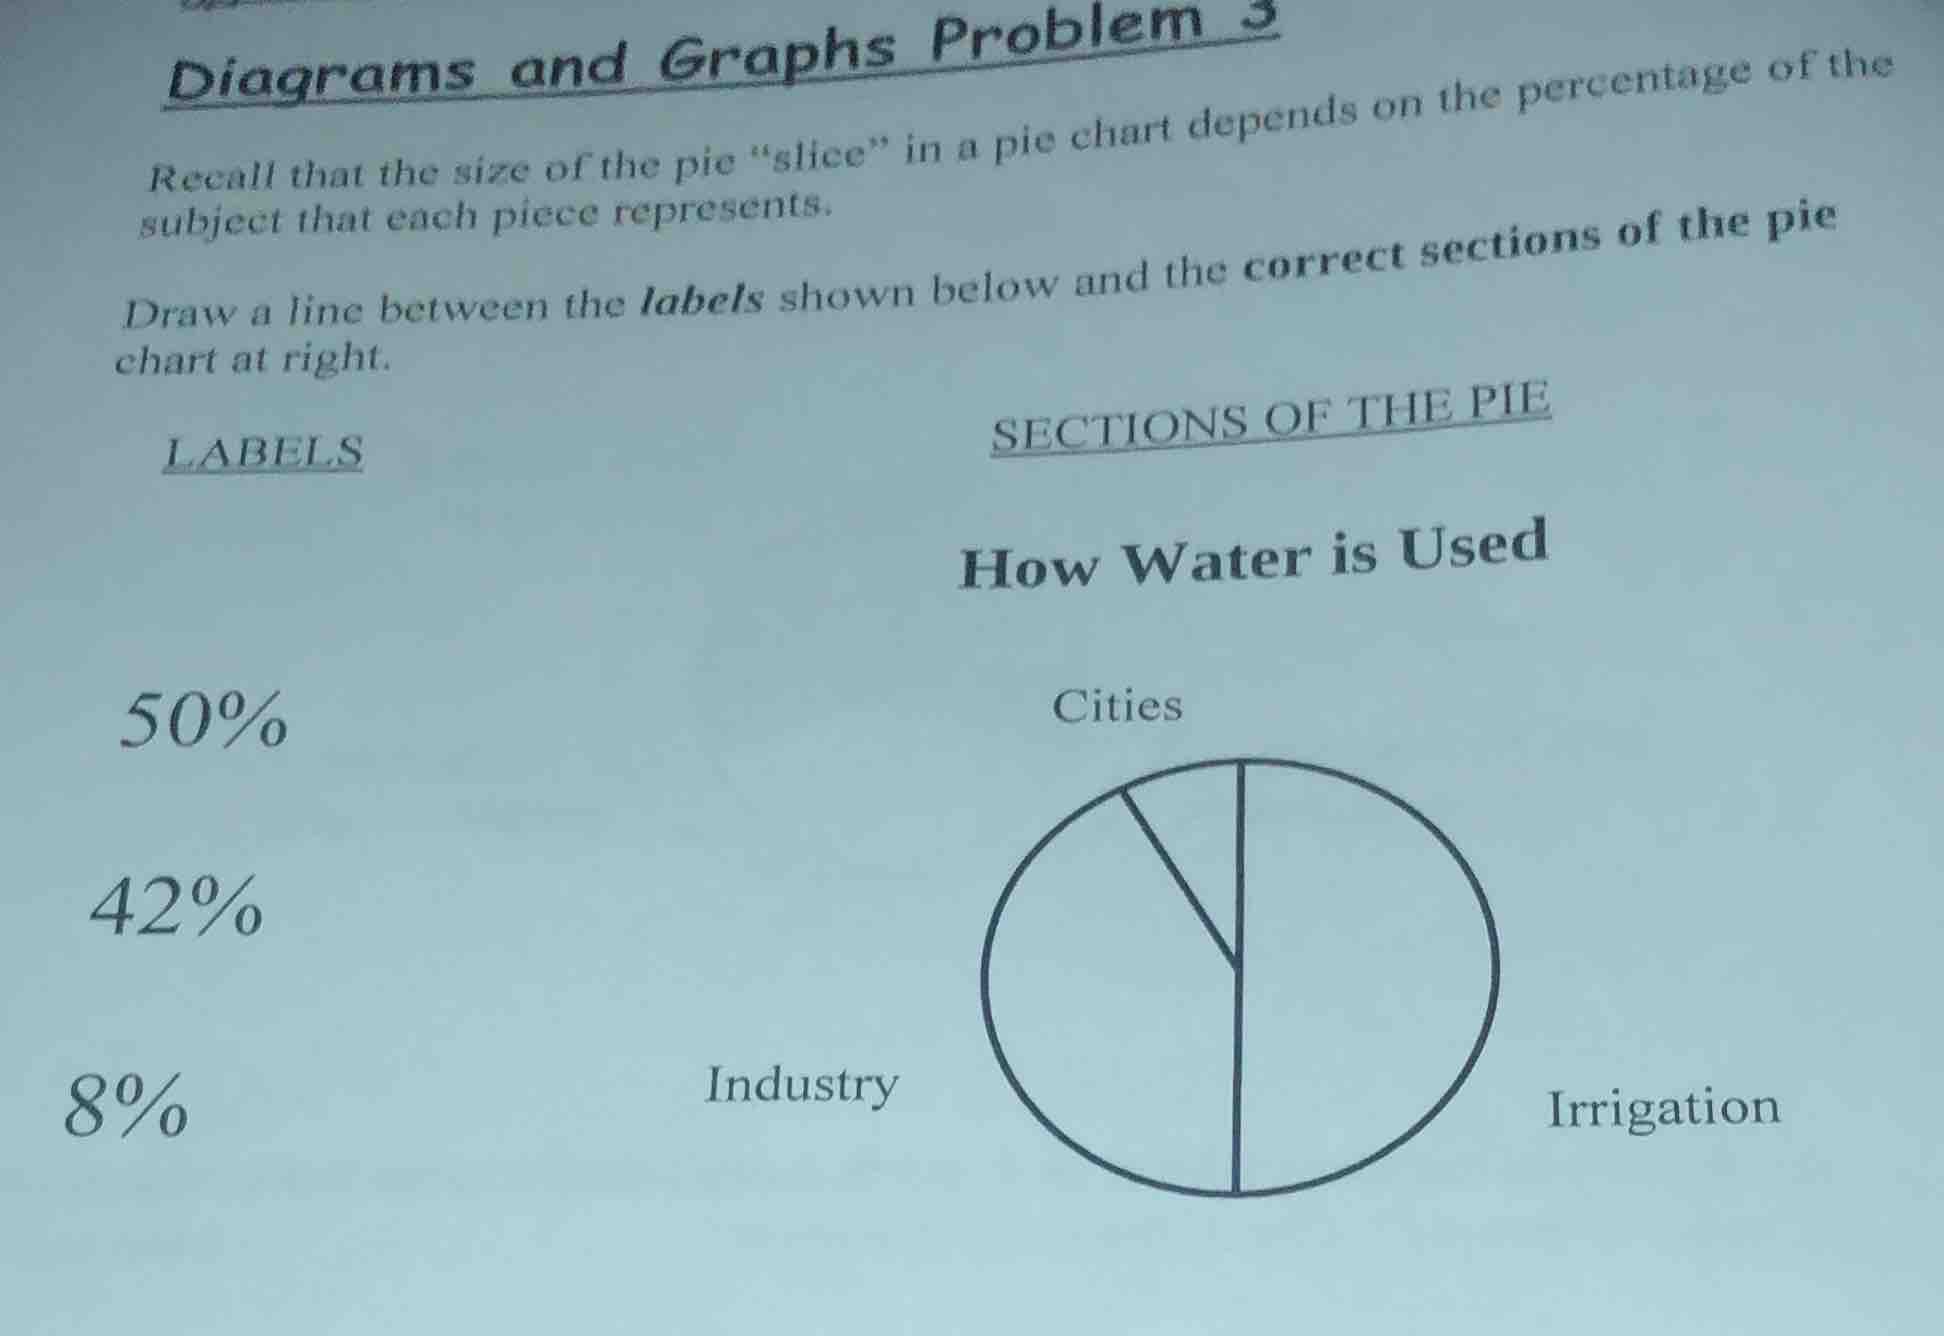
diagrams and graphs problem 3
recall that the size of the pie \slice\ in a pie chart depends on the percentage of the subject that each piece represents.
draw a line between the labels shown below and the correct sections of the pie chart at right.
labels
50%
42%
8%
sections of the pie
how water is used
cities
industry
irrigation
Brief Explanations
To solve this, we analyze the percentages and the pie chart sections:
- A 50% slice would be half the pie (since \(50\%=\frac{1}{2}\)). Looking at the pie chart, "Irrigation" seems to occupy half (the vertical line splits it into two, and one part is labeled Irrigation which looks like 50%).
- 42% is a large portion but less than 50%. The "Industry" section in the pie chart (the larger of the two remaining) should correspond to 42% as it's a significant portion but not half.
- 8% is the smallest percentage. The "Cities" section (the smallest slice) corresponds to 8%.
So we match: 50% - Irrigation, 42% - Industry, 8% - Cities.

Snap & solve any problem in the app
Get step-by-step solutions on Sovi AI
Photo-based solutions with guided steps
Explore more problems and detailed explanations
- \(50\%\) connects to Irrigation.
- \(42\%\) connects to Industry.
- \(8\%\) connects to Cities.