QUESTION IMAGE
Question
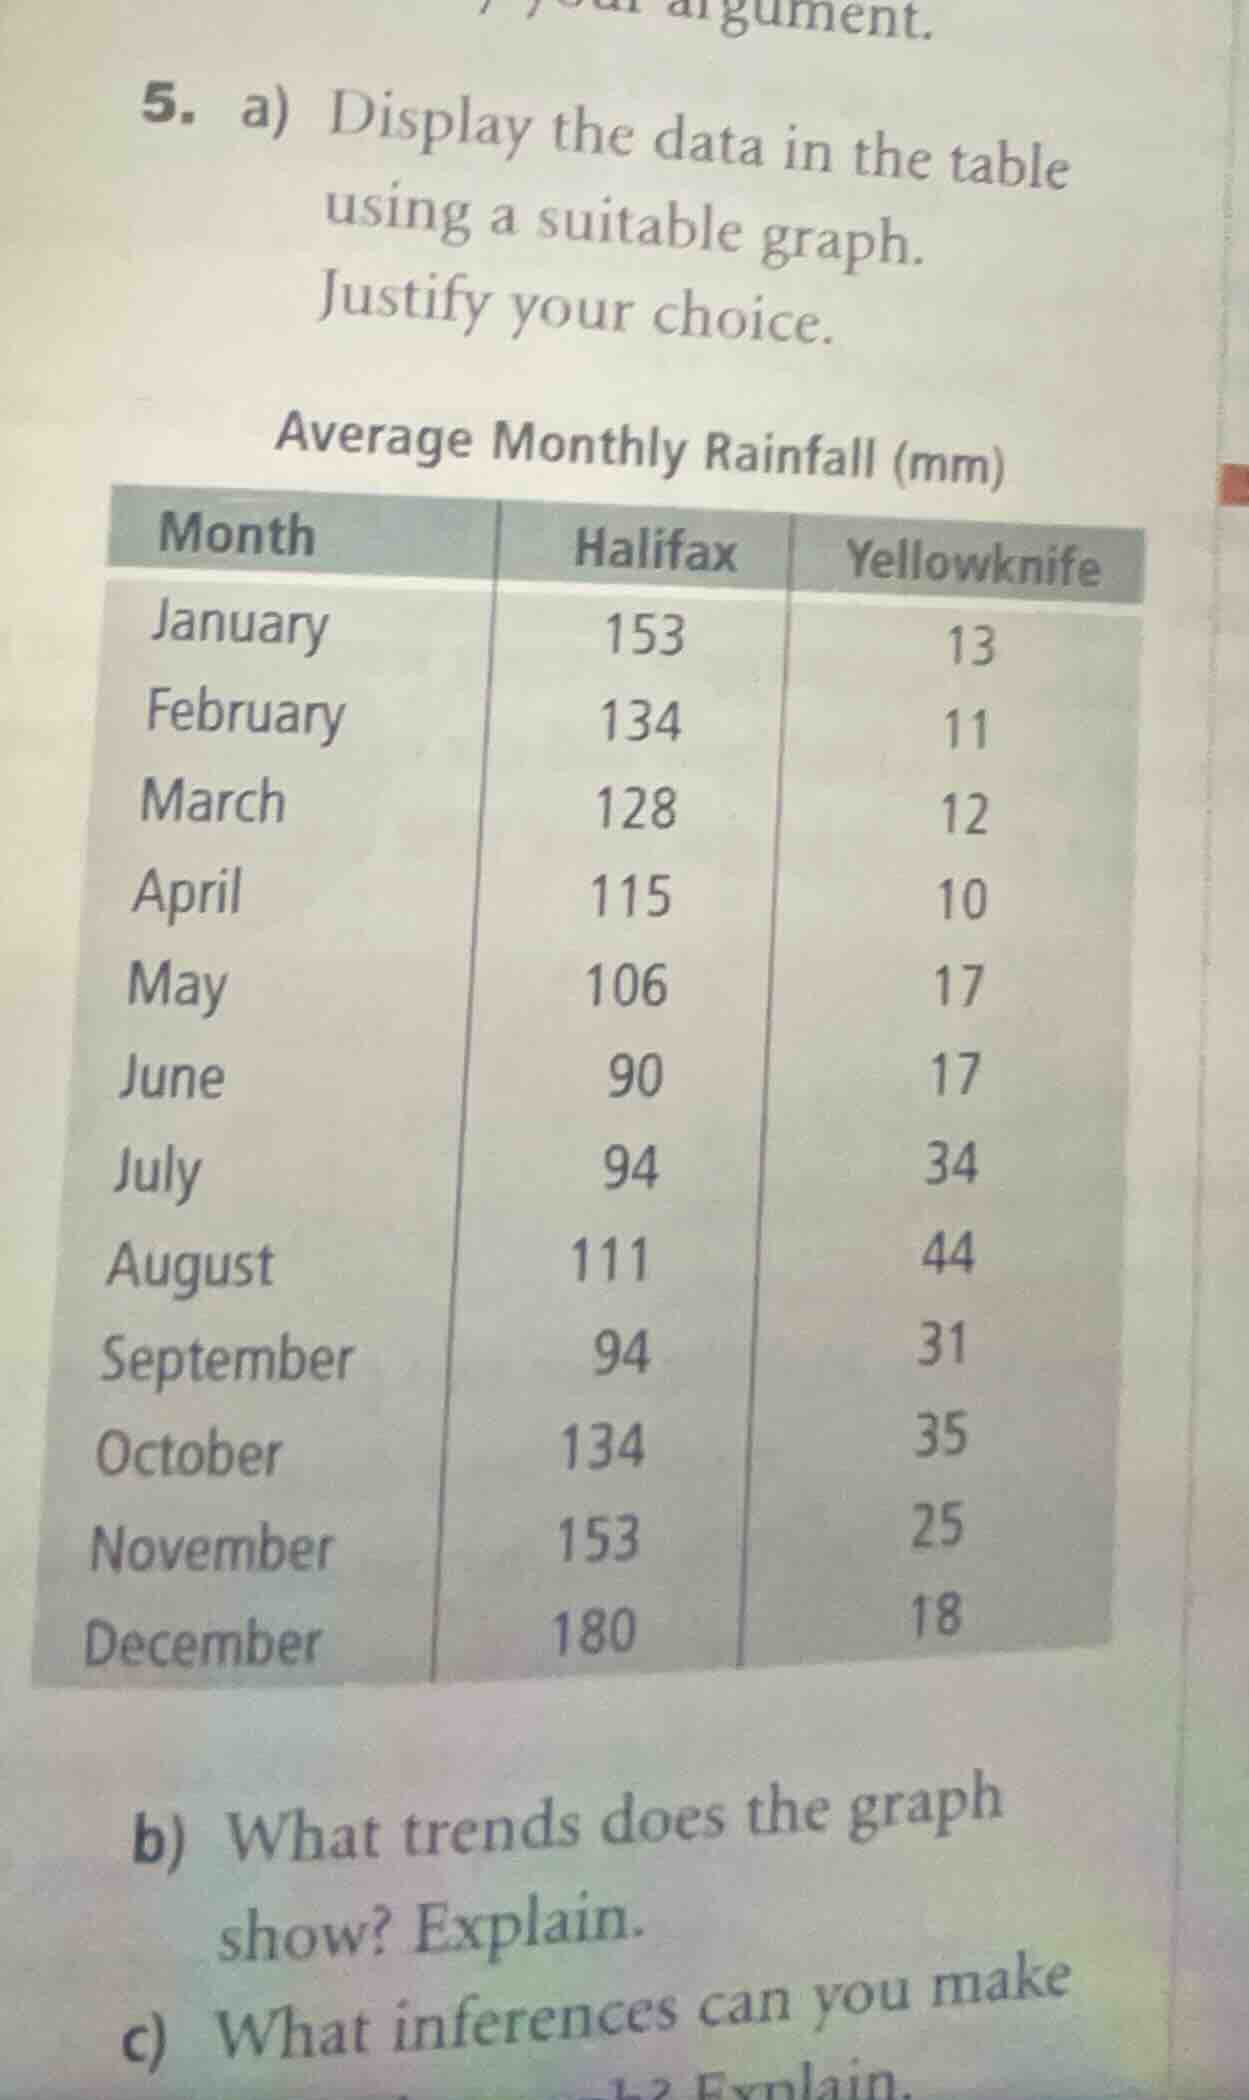
- a) display the data in the table using a suitable graph. justify your choice.
average monthly rainfall (mm)
month\thalifax\tyellowknife
january\t153\t13
february\t134\t11
march\t128\t12
april\t115\t10
may\t106\t17
june\t90\t17
july\t94\t34
august\t111\t44
september\t94\t31
october\t134\t35
november\t153\t25
december\t180\t18
b) what trends does the graph show? explain.
c) what inferences can you make explain.
Step1: Choose graph type
A dual line graph is the suitable choice here, as we are tracking continuous, time-based (monthly) data for two locations, which allows for clear comparison of trends over time.
Step2: Justify graph choice
Line graphs excel at showing changes in quantitative data across a sequential, categorical variable (months). A dual line graph lets us directly compare rainfall patterns between Halifax and Yellowknife in one visual.
Step3: Identify trends from data
- For Halifax: Observe monthly rainfall values: peaks in December ($180$ mm) and January/November ($153$ mm), lowest in June ($90$ mm). Rainfall decreases from January to June, then rises again through the fall/winter.
- For Yellowknife: Observe monthly rainfall values: lowest in April ($10$ mm), highest in August ($44$ mm). Rainfall increases from April to August, then decreases through the fall/winter.
Step4: Draw inferences
Compare the two datasets: Halifax has far higher total annual rainfall (sum all values: $153+134+128+115+106+90+94+111+94+134+153+180 = 1492$ mm) vs. Yellowknife ($13+11+12+10+17+17+34+44+31+35+25+18 = 267$ mm). Halifax has a wet winter/dry summer pattern, while Yellowknife has a dry winter/wet summer pattern.
---

Snap & solve any problem in the app
Get step-by-step solutions on Sovi AI
Photo-based solutions with guided steps
Explore more problems and detailed explanations
Part a)
A dual line graph is the appropriate visualization.
- X-axis: Months (January to December, sequential order)
- Y-axis: Average Monthly Rainfall (mm, scaled to fit 0-180 mm)
- Two lines: One for Halifax, one for Yellowknife, with distinct colors/legends.
Justification: Line graphs clearly display trends in time-series data, and a dual line graph enables direct comparison of rainfall patterns between the two cities.
Part b)
- Halifax: Rainfall is highest in winter (December, January, November) and lowest in late spring/early summer (June). It follows a pattern of decreasing rainfall from January to June, then increasing again through July to December.
- Yellowknife: Rainfall is lowest in winter (February, April, January) and highest in summer (August). It follows a pattern of increasing rainfall from April to August, then decreasing again through September to December.
Part c)
- Halifax has a much wetter climate overall, with total annual rainfall over 5 times higher than Yellowknife.
- Halifax experiences its wettest period during the winter months, while Yellowknife gets the majority of its rain in the summer months.
- Yellowknife has very low, consistent rainfall in the winter, while Halifax has heavy, consistent rainfall in winter.