QUESTION IMAGE
Question
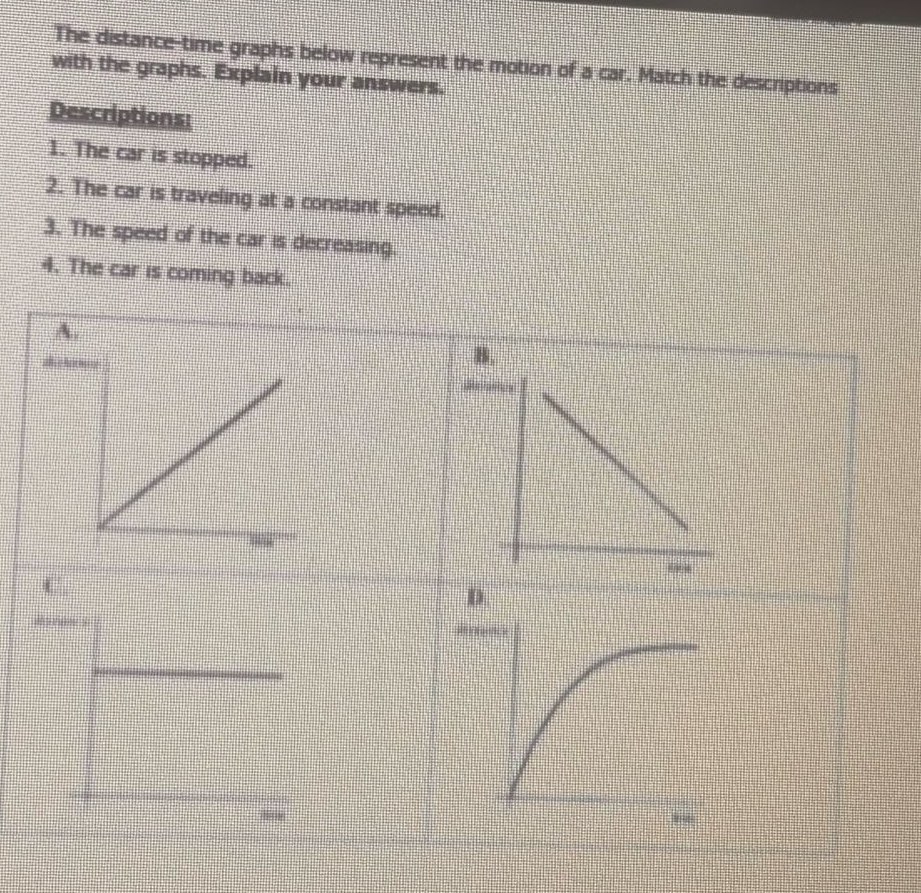
the distance - time graphs below represent the motion of a car. match the descriptions with the graphs. explain your answers.
descriptions:
- the car is stopped.
- the car is traveling at a constant speed.
- the speed of the car is decreasing.
- the car is coming back.
Step1: Analyze Graph A
In a distance - time graph, the slope represents speed. For graph A, the slope is constant (a straight line with a constant positive slope). A constant slope in a distance - time graph means the speed is constant. So graph A matches description 2 (The car is traveling at a constant speed).
Step2: Analyze Graph B
The distance in graph B is decreasing as time increases (the line has a negative slope). If the distance from the starting point is decreasing, it means the car is moving back towards the starting point. So graph B matches description 4 (The car is coming back).
Step3: Analyze Graph C
In graph C, the distance remains the same as time changes (the line is horizontal, slope = 0). A slope of 0 in a distance - time graph means the speed is 0, so the car is stopped. So graph C matches description 1 (The car is stopped).
Step4: Analyze Graph D
The slope of graph D is decreasing (the curve is getting flatter). Since slope represents speed in a distance - time graph, a decreasing slope means the speed is decreasing. So graph D matches description 3 (The speed of the car is decreasing).

Snap & solve any problem in the app
Get step-by-step solutions on Sovi AI
Photo-based solutions with guided steps
Explore more problems and detailed explanations
1 - C (The car is stopped as distance doesn't change with time in graph C), 2 - A (Constant slope means constant speed in graph A), 3 - D (Decreasing slope means decreasing speed in graph D), 4 - B (Decreasing distance means coming back in graph B)