QUESTION IMAGE
Question
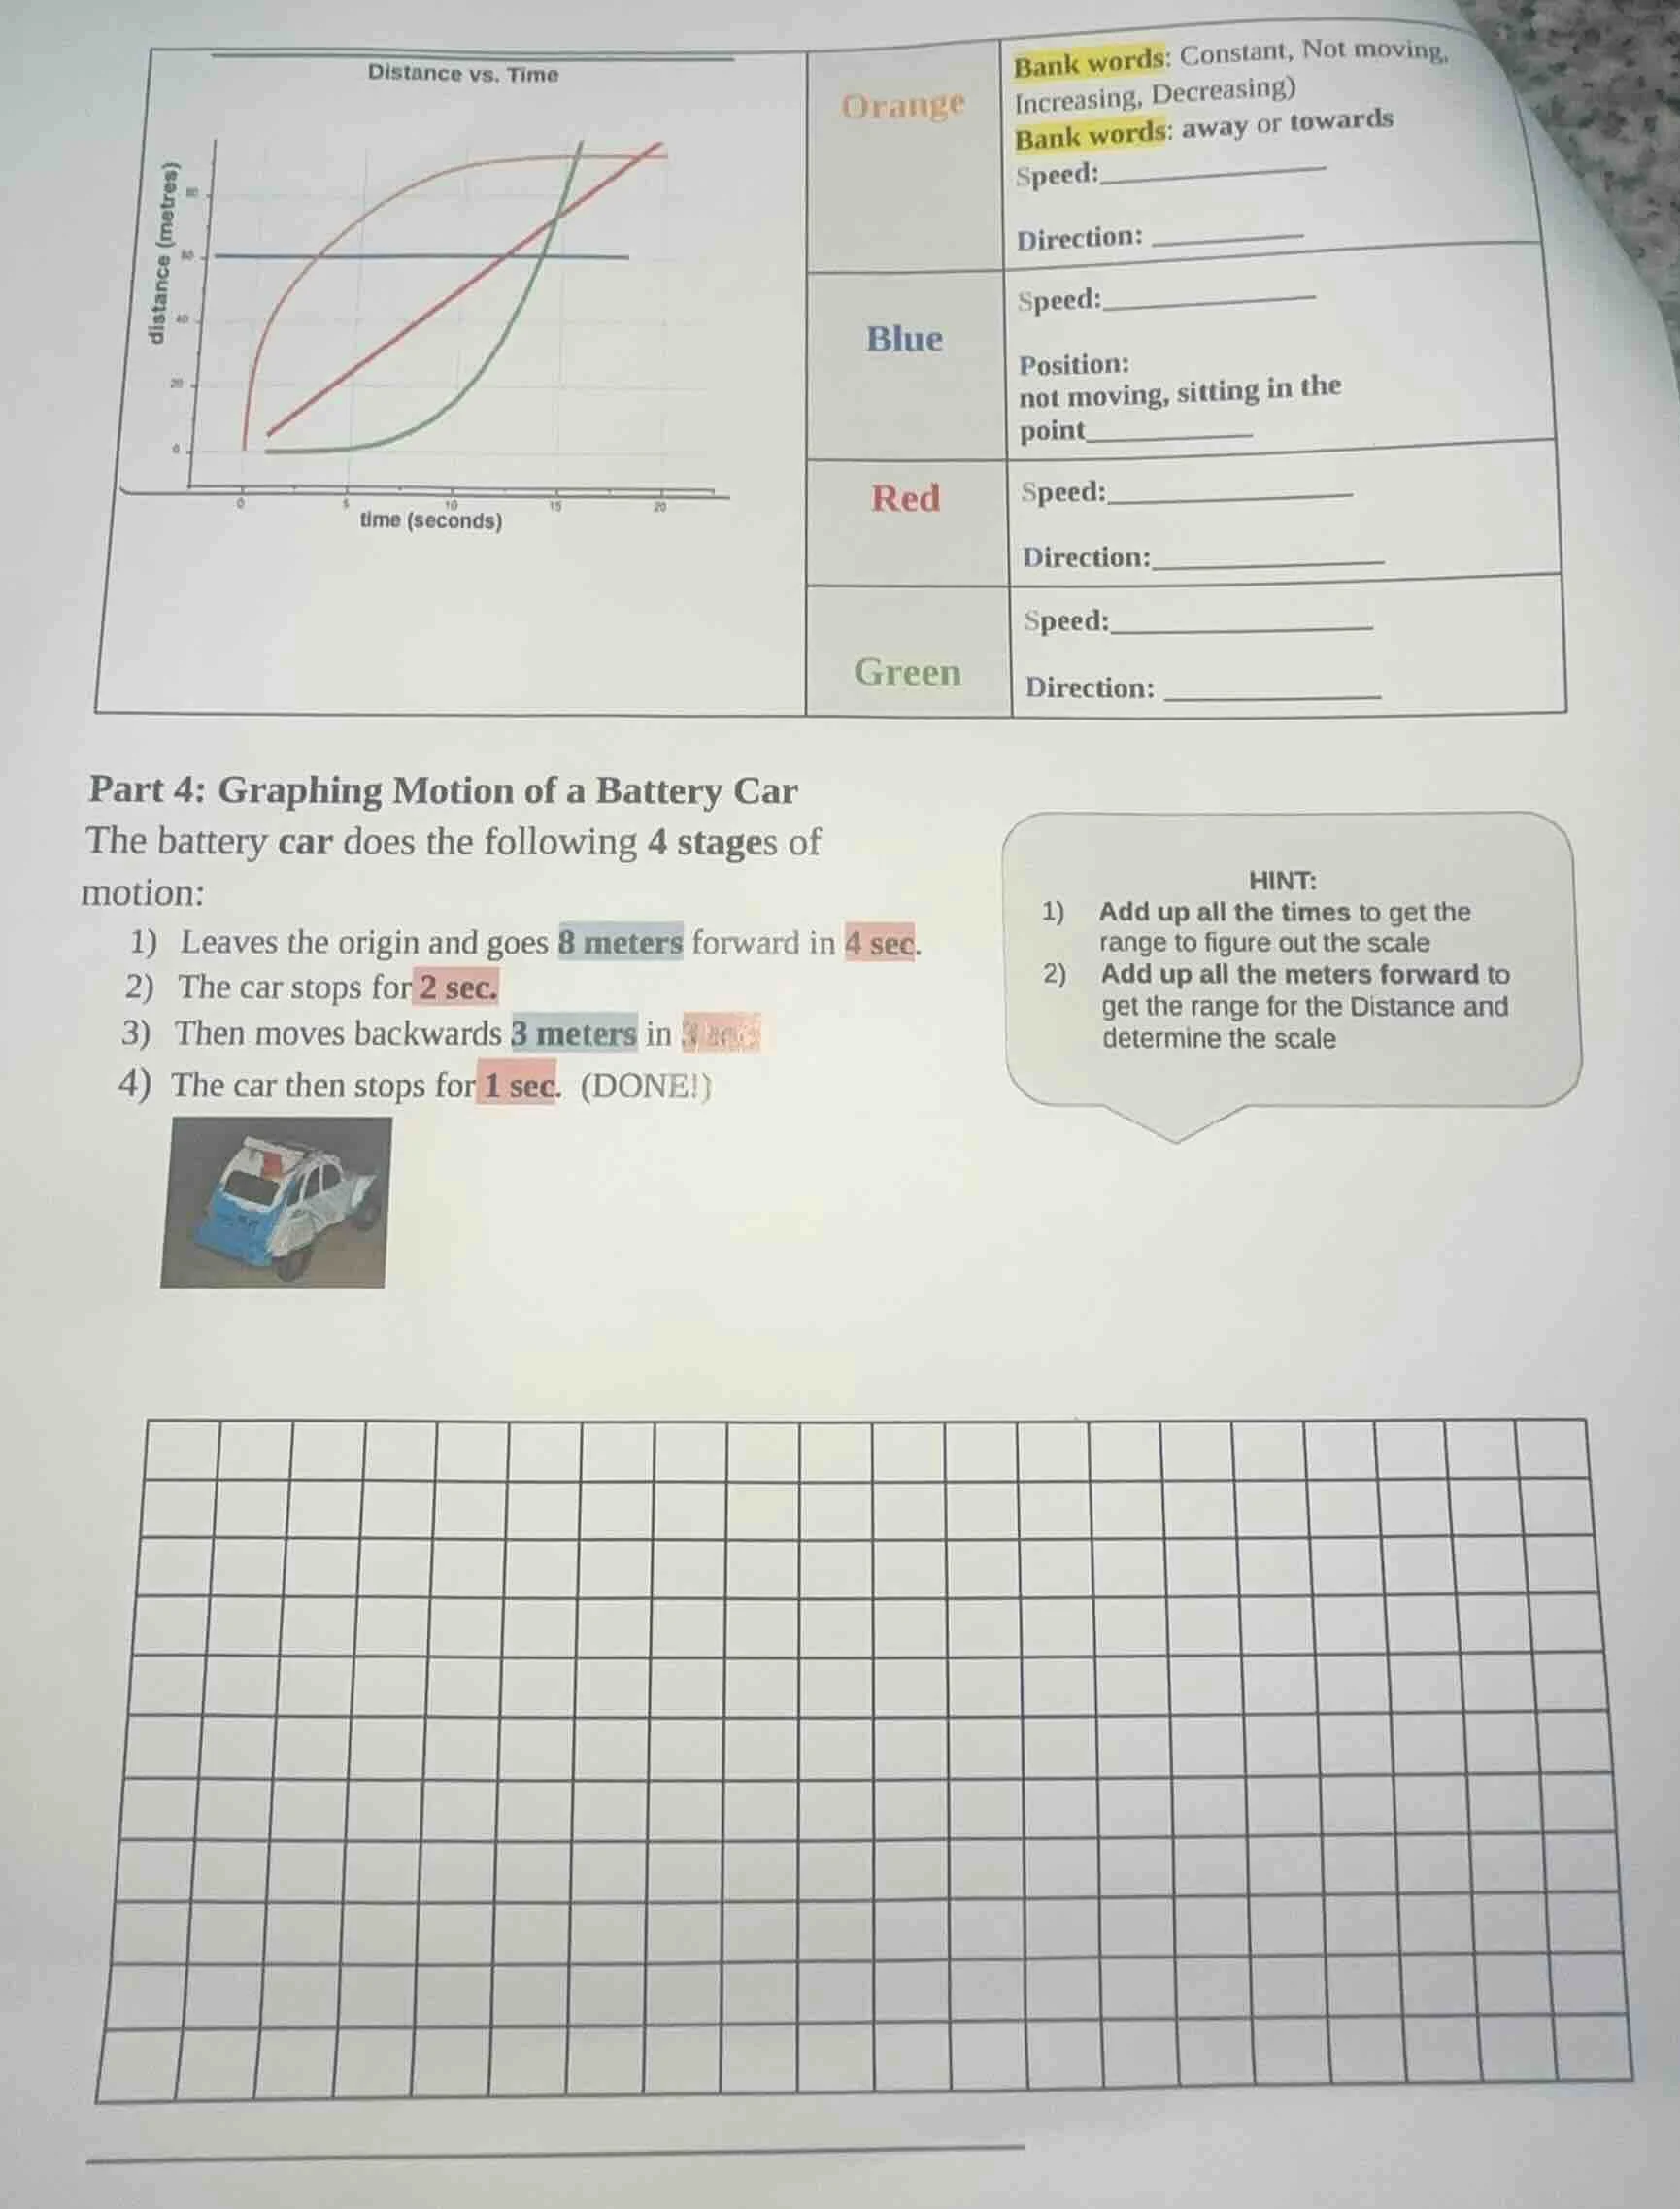
distance vs. timebank words: constant, not moving,increasing, decreasing)bank words: away or towardsorangespeed:________direction:______bluespeed:______position:not moving, sitting in thepoint______redspeed:______direction:______greenspeed:______direction:________part 4: graphing motion of a battery carthe battery car does the following 4 stages ofmotion:1) leaves the origin and goes 8 meters forward in 4 sec.2) the car stops for 2 sec.3) then moves backwards 3 meters in 3 sec.4) the car then stops for 1 sec. (done!)hint:1) add up all the times to get therange to figure out the scale2) add up all the meters forward toget the range for the distance anddetermine the scale
---
Top Graph Analysis Steps:
Step1: Analyze Orange line
Horizontal line = constant distance.
Speed: Not moving; Direction: N/A (stationary)
Step2: Analyze Blue line
Curved line, slope decreases over time.
Speed: Decreasing; Direction: away (distance increases)
Step3: Analyze Red line
Straight, positive slope = steady speed.
Speed: Constant; Direction: away (distance increases)
Step4: Analyze Green line
Curved line, slope increases over time.
Speed: Increasing; Direction: away (distance increases)
---
Battery Car Graph Steps:
Step1: Calculate total time
Total time = $4 + 2 + 3 + 1 = 10$ sec
Step2: Calculate position range
Max position = 8 m; Min position = 0 m; Final position = $8 - 3 = 5$ m
Step3: Define key time-position points
- 0 sec: 0 m (start at origin)
- 4 sec: 8 m (end of forward motion)
- 6 sec: 8 m (end of 2 sec stop)
- 9 sec: 5 m (end of backward motion)
- 10 sec: 5 m (end of 1 sec stop)
Step4: Set graph scale
Time axis: 1 square = 1 sec (fits 10 sec total). Position axis: 1 square = 1 m (fits 8 m max).
Step5: Plot and connect points
Draw straight lines between consecutive points to represent each motion stage.

Snap & solve any problem in the app
Get step-by-step solutions on Sovi AI
Photo-based solutions with guided steps
Explore more problems and detailed explanations
Top Section (Distance vs. Time Graph Analysis):
- Orange: Speed: Constant; Direction: away
- Blue: Speed: Not moving; Position: 60
- Red: Speed: Constant; Direction: away
- Green: Speed: Increasing; Direction: away
Bottom Section (Battery Car Motion Graph):
| Time (sec) | Position (metres) |
|---|---|
| 4 | 8 |
| 6 | 8 |
| 9 | 5 |
| 10 | 5 |
(Graph scale: Time axis: 1 square = 1 sec; Position axis: 1 square = 1 metre. Plot the points above and connect with straight lines between each interval.)