QUESTION IMAGE
Question
distances that people live from the mall.
the difference in the results shows that javiers sample had a larger standard deviation than ercilias sample. this shows that, although the mean distance appears to be around 6 miles, there is probably some variability in the distances that people live from the mall.
the difference in the results shows that javiers sample had a smaller standard deviation than ercilias sample. this shows that, although the mean distance appears to be around 6 miles, there is probably some variability in the distances that people live from the mall.
the difference in the results shows that javiers sample had a larger standard deviation than ercilias sample. this shows that there is not any variability in the distances that people live from the mall.
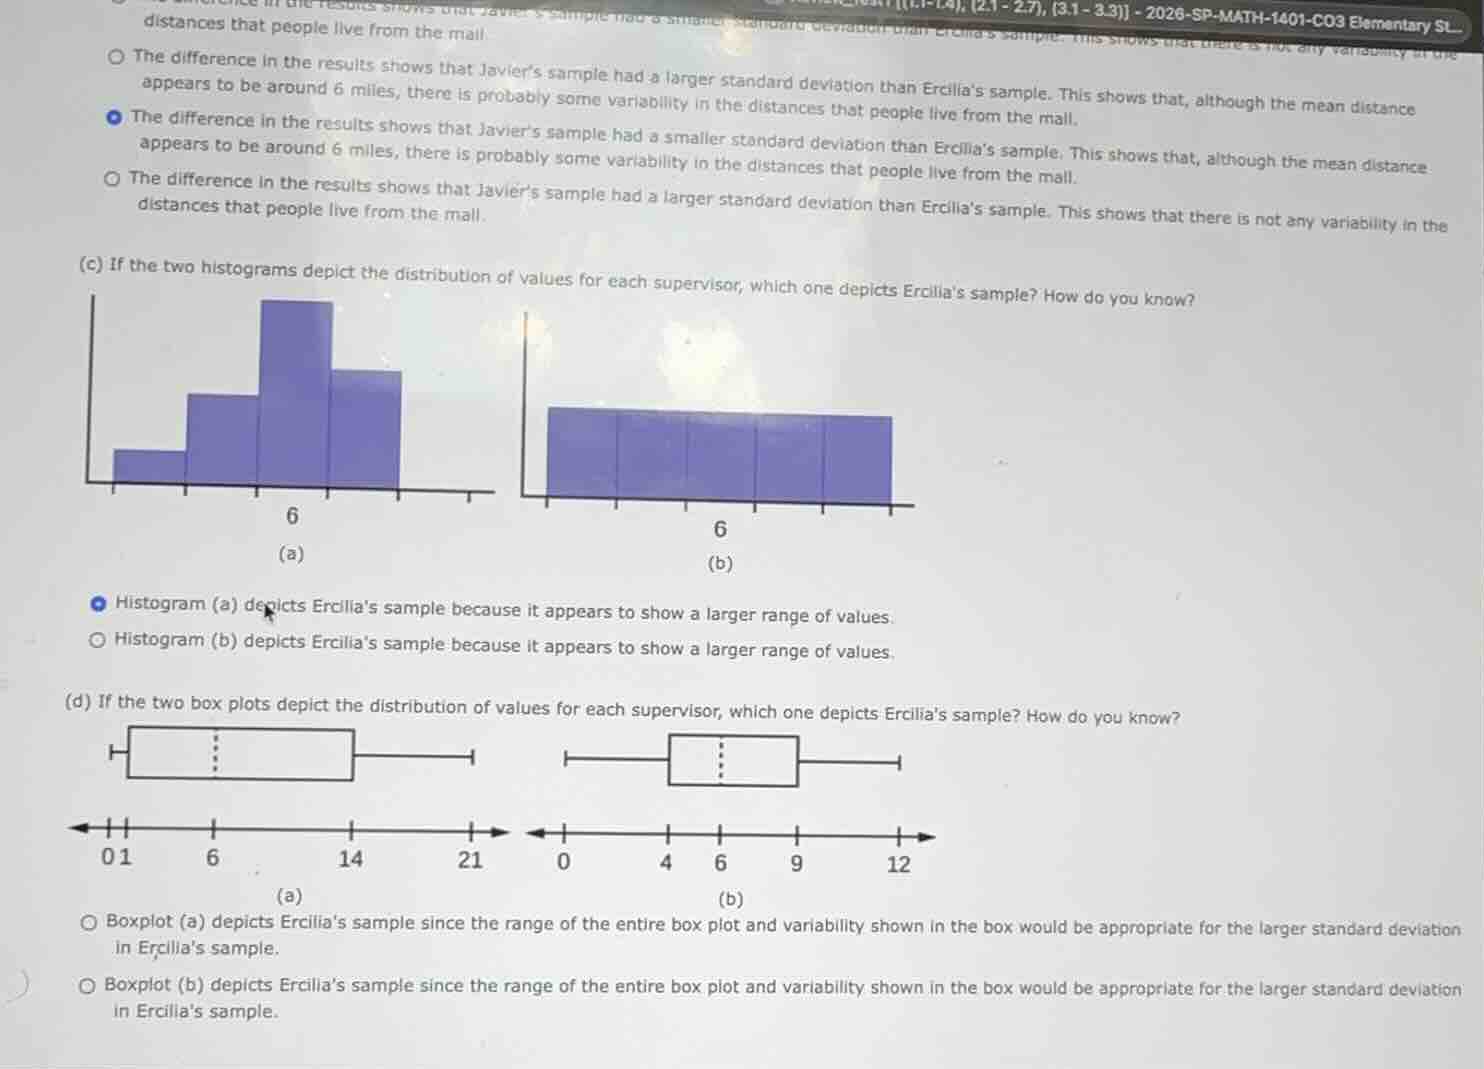
(c) if the two histograms depict the distribution of values for each supervisor, which one depicts ercilias sample? how do you know?
histogram (a) depicts ercilias sample because it appears to show a larger range of values.
histogram (b) depicts ercilias sample because it appears to show a larger range of values.
(d) if the two box plots depict the distribution of values for each supervisor, which one depicts ercilias sample? how do you know?
boxplot (a) depicts ercilias sample since the range of the entire box plot and variability shown in the box would be appropriate for the larger standard deviation in ercilias sample.
boxplot (b) depicts ercilias sample since the range of the entire box plot and variability shown in the box would be appropriate for the larger standard deviation in ercilias sample.
Part (c)
To determine which histogram depicts Ercilia’s sample, we analyze the range of values. A larger standard deviation (from prior context) implies a larger range. Histogram (a) has values spread out (larger range), while (b) is more uniform. The correct option states Histogram (a) shows a larger range, matching Ercilia’s sample (with larger standard deviation).
For box plots, a larger standard deviation means a larger range (whiskers) and more spread in the box. Boxplot (a) has a wider range (whiskers from ~0 to 21) and more spread, fitting Ercilia’s sample (larger standard deviation). The option for Boxplot (a) correctly links its larger range/variability to Ercilia’s sample.

Snap & solve any problem in the app
Get step-by-step solutions on Sovi AI
Photo-based solutions with guided steps
Explore more problems and detailed explanations
Histogram (a) depicts Ercilia's sample because it appears to show a larger range of values.