QUESTION IMAGE
Question
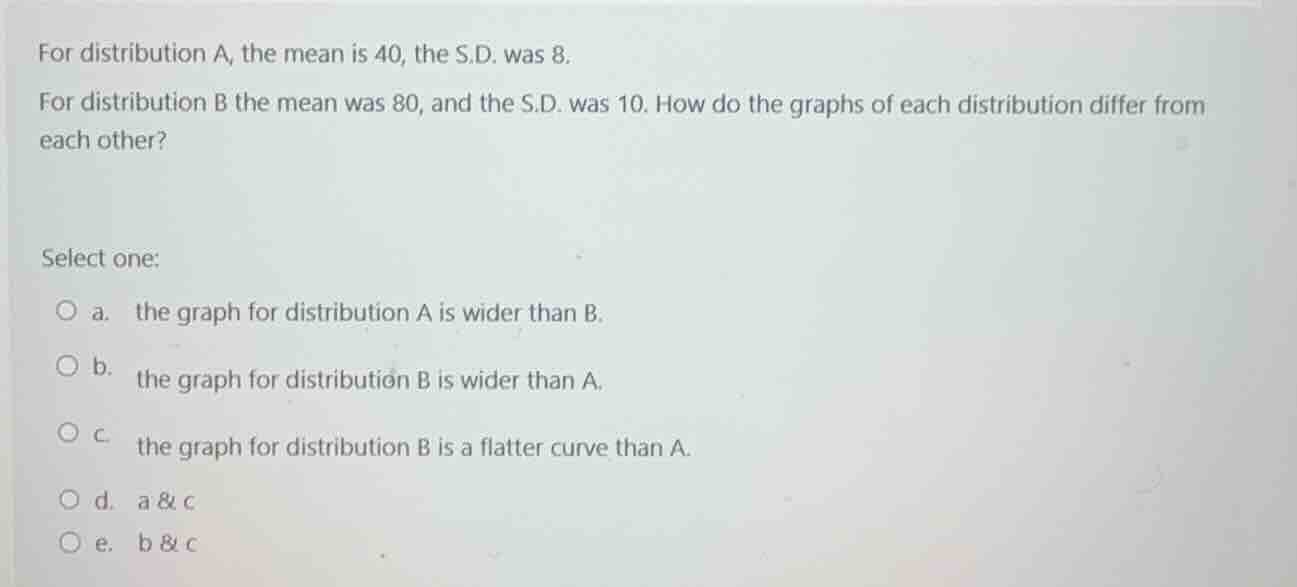
for distribution a, the mean is 40, the s.d. was 8.
for distribution b the mean was 80, and the s.d. was 10. how do the graphs of each distribution differ from each other?
select one:
a. the graph for distribution a is wider than b.
b. the graph for distribution b is wider than a.
c. the graph for distribution b is a flatter curve than a.
d. a & c
e. b & c
Step1: Analyze standard deviation width
Standard deviation (S.D.) measures spread: larger S.D. = wider graph.
Distribution A S.D. = 8, Distribution B S.D. = 10. Since $10>8$, B's graph is wider than A.
Step2: Relate S.D. to curve flatness
A wider spread (higher S.D.) means the curve is flatter (data is more dispersed). So B's curve is flatter than A.
Step3: Match to options
Points 1 and 2 correspond to options b and c.

Snap & solve any problem in the app
Get step-by-step solutions on Sovi AI
Photo-based solutions with guided steps
Explore more problems and detailed explanations
e. b & c