QUESTION IMAGE
Question
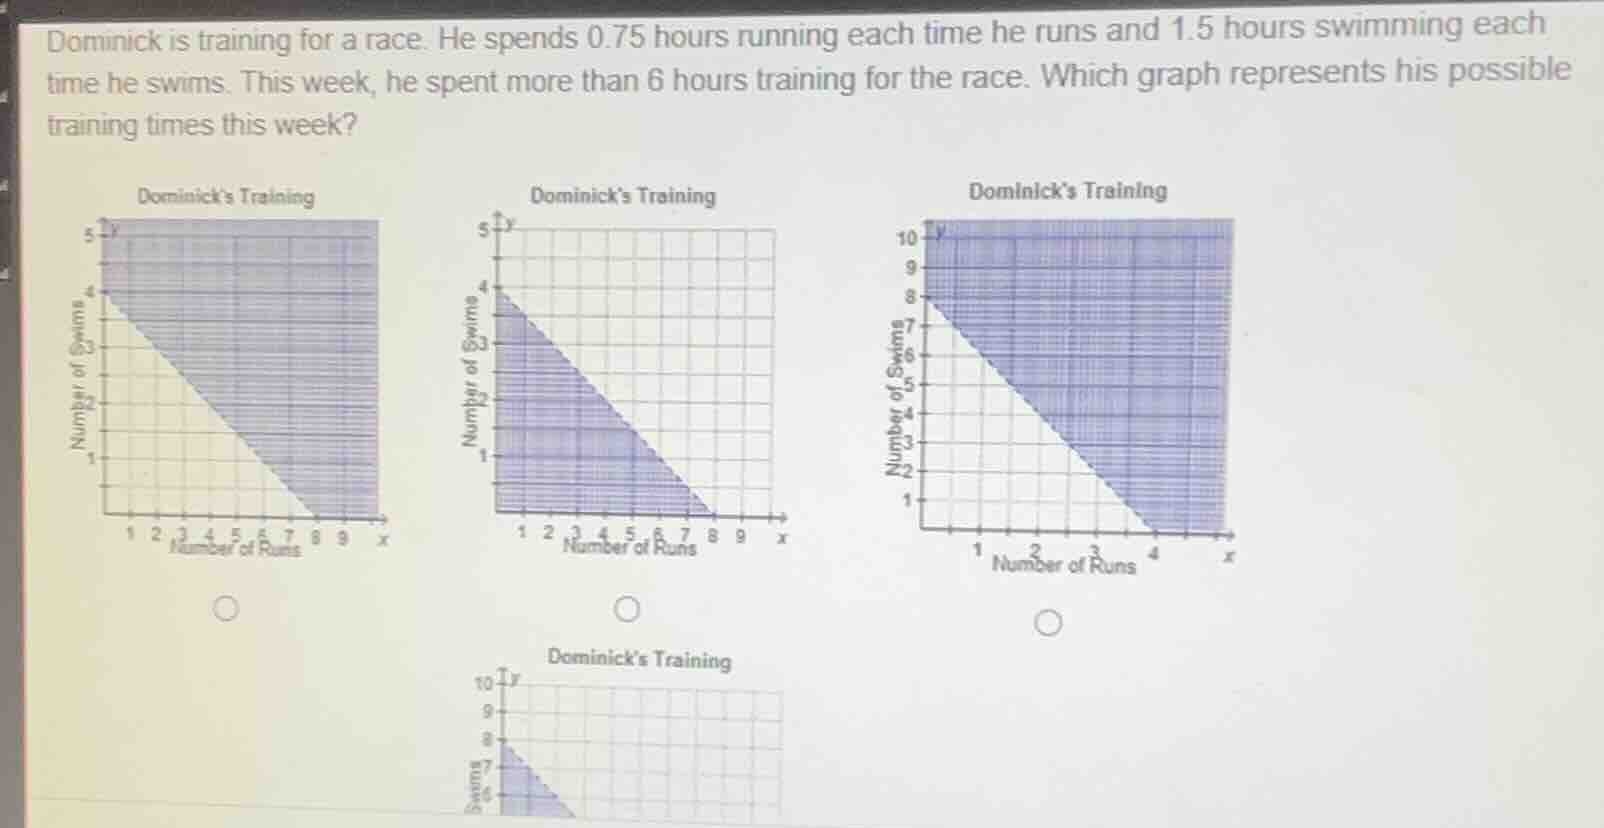
dominick is training for a race. he spends 0.75 hours running each time he runs and 1.5 hours swimming each time he swims. this week, he spent more than 6 hours training for the race. which graph represents his possible training times this week?
Step1: Define variables
Let $x$ = number of runs, $y$ = number of swims.
Step2: Set up inequality
Total training time > 6 hours:
$0.75x + 1.5y > 6$
Step3: Simplify the inequality
Divide all terms by 0.75:
$x + 2y > 8$
Rearrange to slope-intercept form:
$y > -\frac{1}{2}x + 4$
Step4: Analyze graph requirements
- Boundary line: $y = -\frac{1}{2}x + 4$ (dashed, since inequality is strict)
- Shaded region: Above the line (since $y >$ expression)
- Intercepts: When $x=0$, $y=4$; when $y=0$, $x=8$

Snap & solve any problem in the app
Get step-by-step solutions on Sovi AI
Photo-based solutions with guided steps
Explore more problems and detailed explanations
The first graph (top-left, with x-axis up to 9, y-axis up to 5, shaded region above the line connecting (0,4) and (8,0))