QUESTION IMAGE
Question
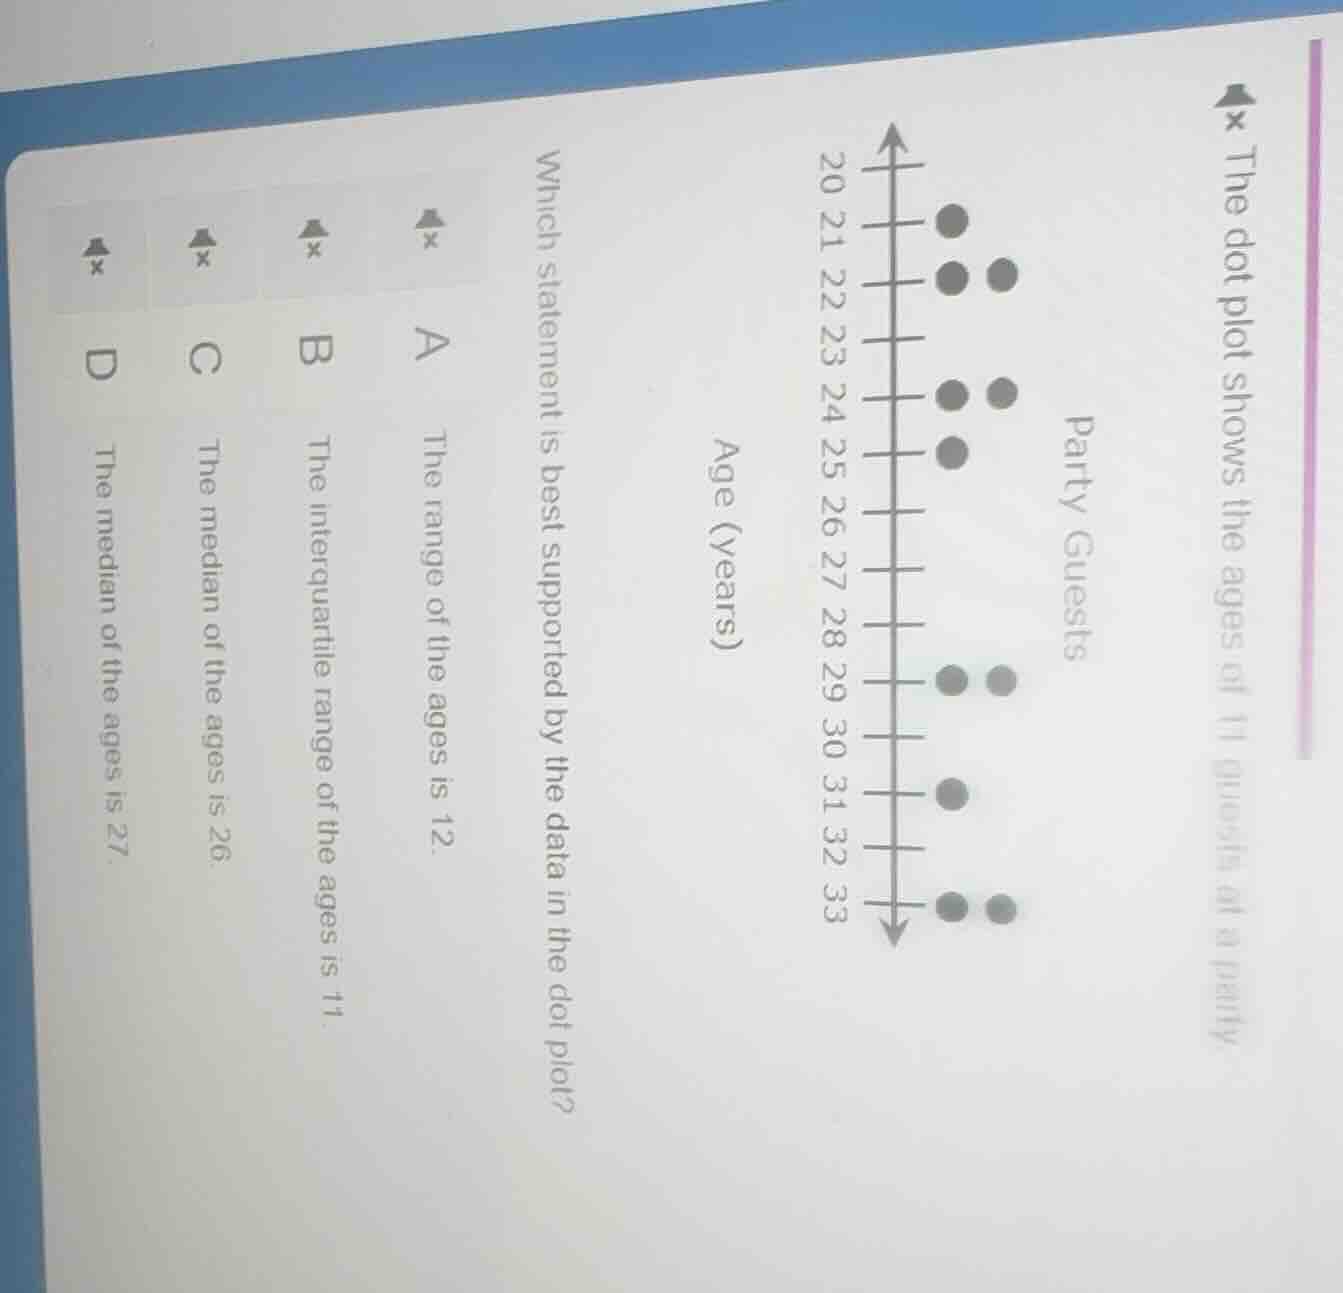
the dot plot shows the ages of 11 guests at a party
party guests
age (years)
20 21 22 23 24 25 26 27 28 29 30 31 32 33
which statement is best supported by the data in the dot plot?
a the range of the ages is 12.
b the interquartile range of the ages is 11.
c the median of the ages is 26.
d the median of the ages is 27.
Step1: List all ages from dot plot
21, 22, 22, 24, 24, 25, 29, 29, 31, 33, 33
Step2: Calculate the range
Range = Max - Min = $33 - 21 = 12$
Step3: Find the median
Data has 11 values, median is 6th value: $25$
Step4: Calculate interquartile range
Q1 = 3rd value = 22, Q3 = 9th value = 31
IQR = $31 - 22 = 9$
Step5: Verify each option
Option A matches range=12; B (IQR=11) wrong; C (median=26) wrong; D (median=27) wrong.

Snap & solve any problem in the app
Get step-by-step solutions on Sovi AI
Photo-based solutions with guided steps
Explore more problems and detailed explanations
A. The range of the ages is 12.