QUESTION IMAGE
Question
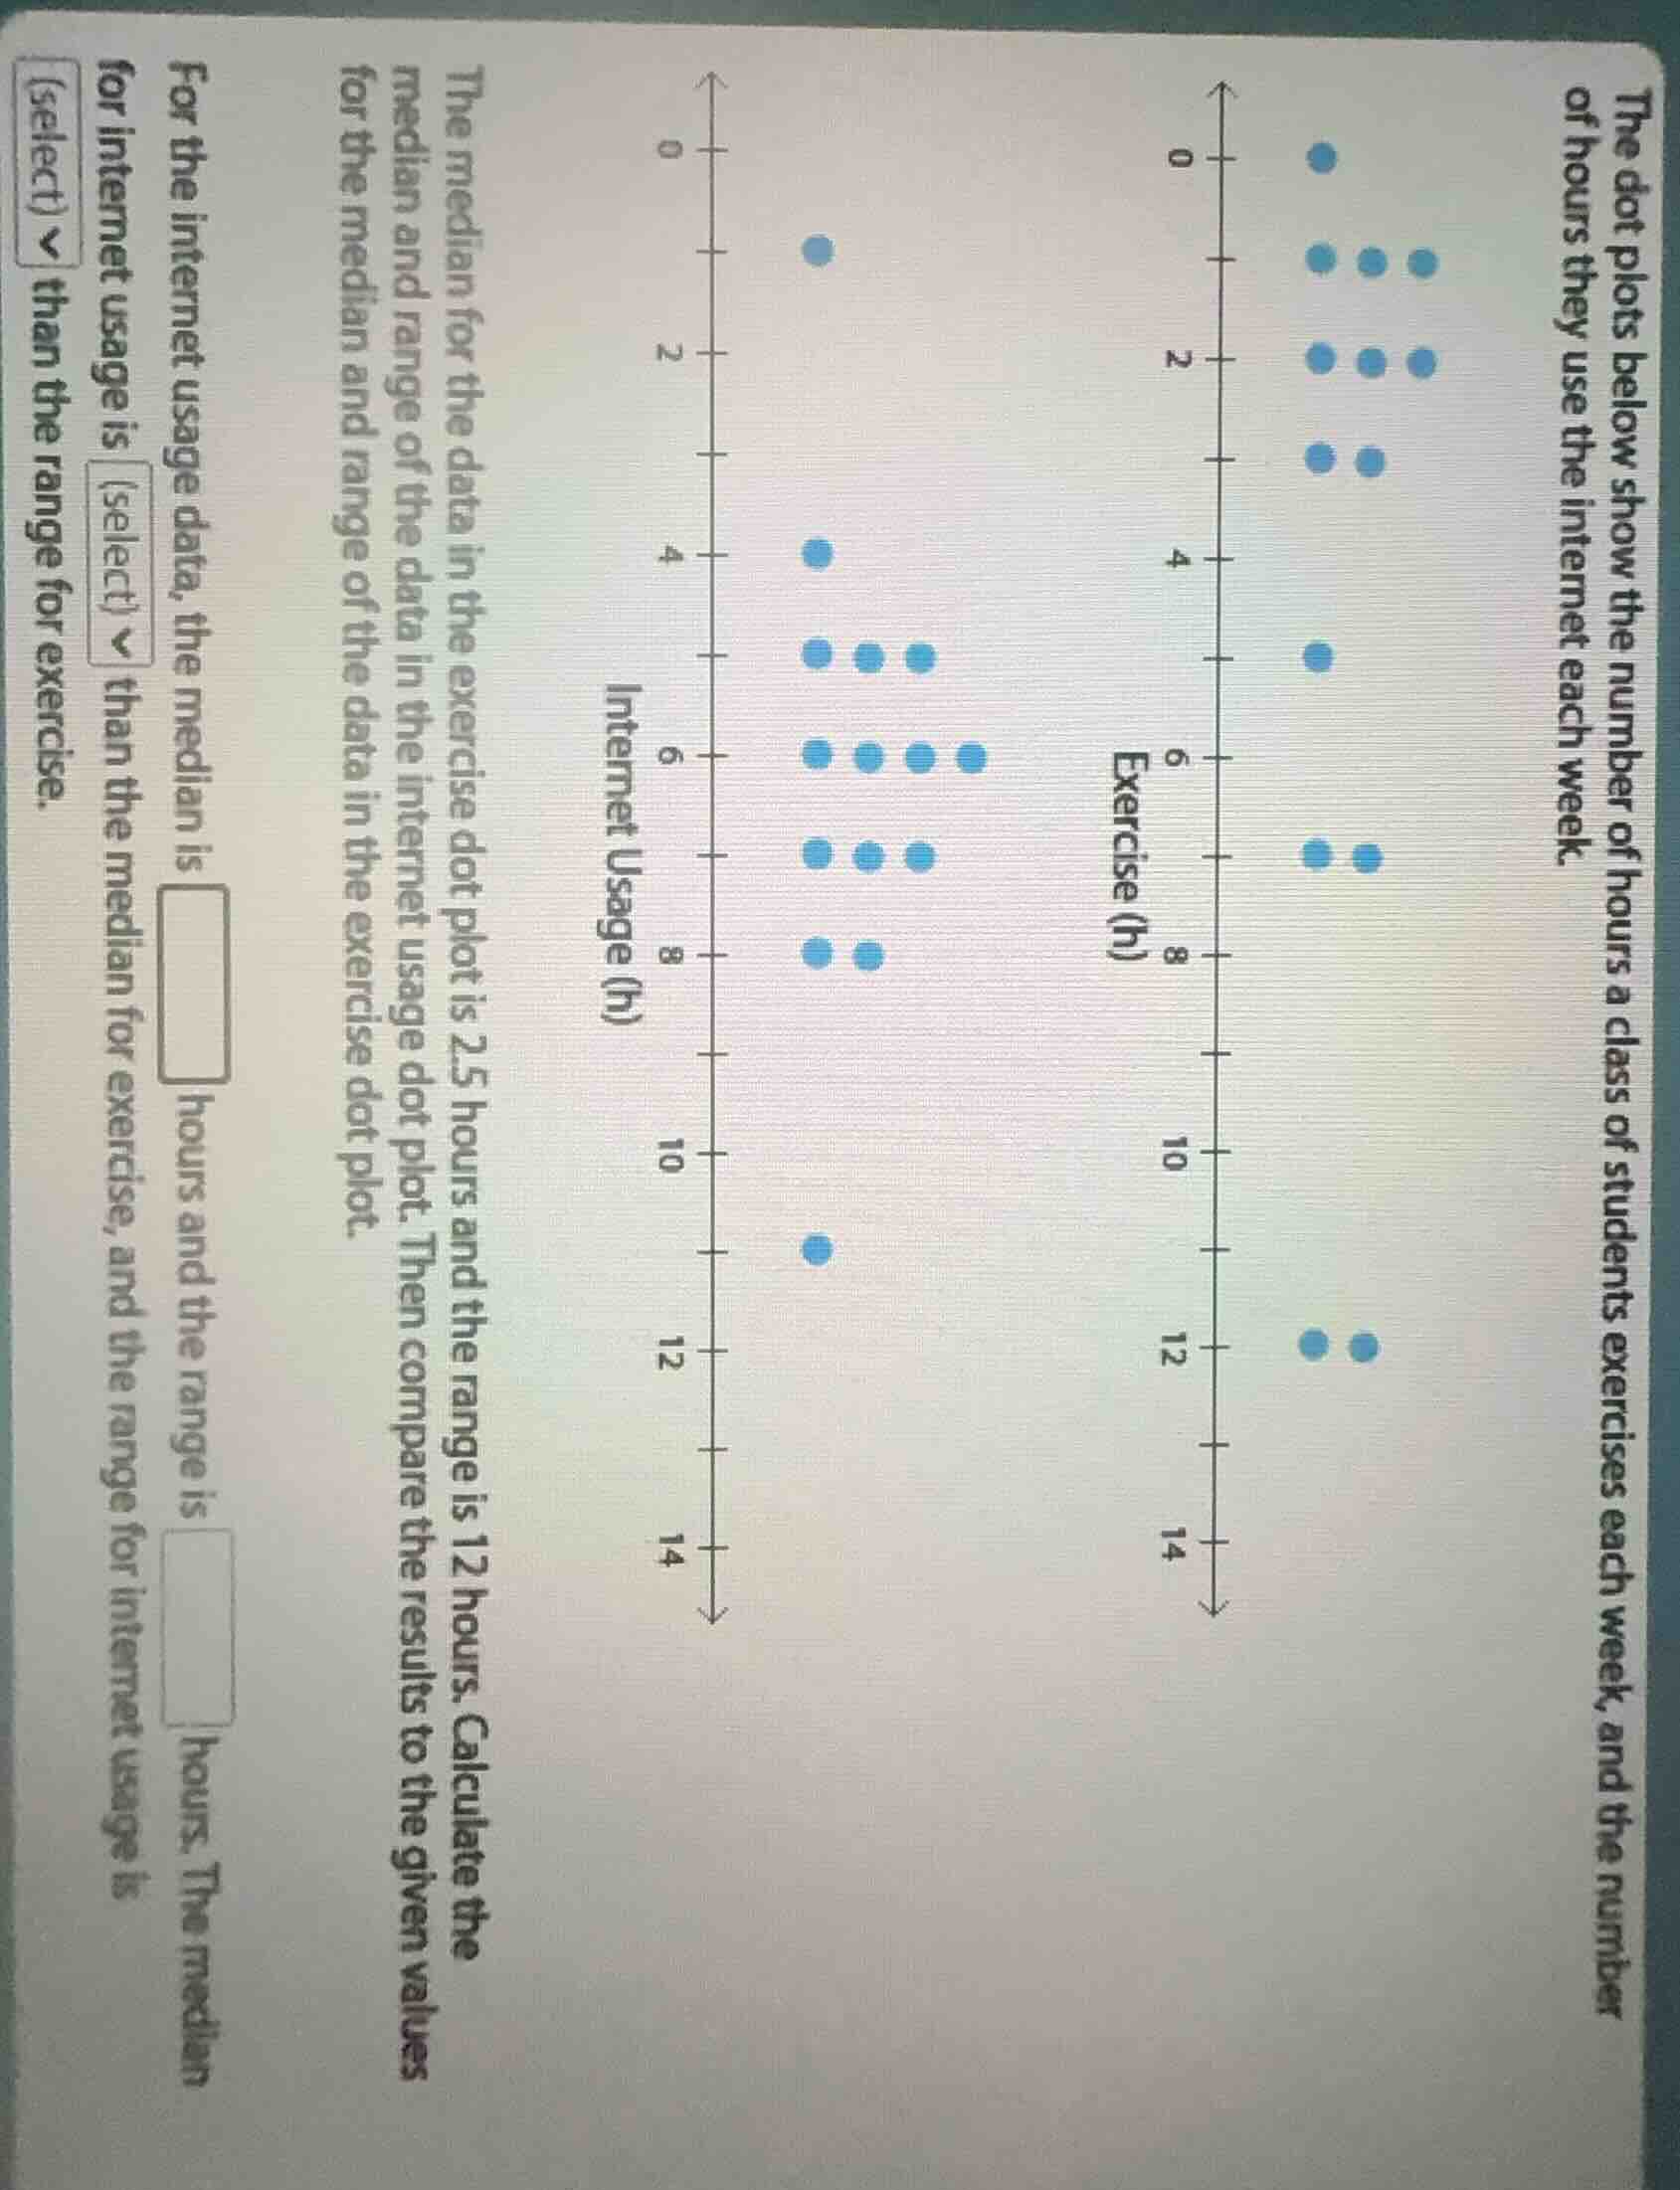
the dot plots below show the number of hours a class of students exercises each week, and the number of hours they use the internet each week.
the median for the data in the exercise dot plot is 2.5 hours and the range is 12 hours. calculate the median and range of the data in the internet usage dot plot. then compare the results to the given values
for the internet usage data, the median is
hours and the range is
hours. the median for internet usage is
than the median for exercise, and the range for internet usage is
than the range for exercise.
Step1: Count data points for Internet Usage
First, we count the number of dots (data points) in the Internet Usage dot plot. Let's list the number of dots at each value:
- 1: 1 dot
- 4: 1 dot
- 5: 3 dots (wait, no, looking at the plot: let's re - examine. Wait, the x - axis for Internet Usage:
Wait, the dots are at:
1: 1
4: 1
5: 3? Wait, no, let's count properly. Let's list the positions:
- At 1: 1 dot
- At 4: 1 dot
- At 5: 3 dots? Wait, no, the plot: let's see the y - axis is not, the x - axis is the hours. Wait, the Internet Usage dot plot:
Looking at the plot, the values (x - axis) and the number of dots:
- x = 1: 1 dot
- x = 4: 1 dot
- x = 5: 3 dots? Wait, no, maybe I misread. Wait, let's count all the dots:
First, let's list each dot's x - value:
1, 4, 5, 5, 5, 6, 6, 6, 6, 7, 7, 7, 8, 8, 11. Wait, no, maybe a better way: count the number of dots. Let's count:
At x = 1: 1
x = 4: 1
x = 5: 3 (three dots)
x = 6: 4 (four dots)
x = 7: 3 (three dots)
x = 8: 2 (two dots)
x = 11: 1 (one dot)
Now, sum these up: 1+1 + 3+4+3+2+1=15 data points.
Step2: Find the median for Internet Usage
Since there are 15 data points, the median is the \((\frac{15 + 1}{2})\)-th = 8 - th value when the data is ordered from least to greatest.
Let's order the data:
1, 4, 5, 5, 5, 6, 6, 6, 6, 7, 7, 7, 8, 8, 11
Now, the 8 - th value is 6. So the median for Internet Usage is 6 hours.
Step3: Find the range for Internet Usage
The range is calculated as the maximum value minus the minimum value.
The minimum value in Internet Usage data is 1, and the maximum value is 11.
So the range = \(11-1 = 10\) hours.
Step4: Compare median and range with Exercise data
- Median comparison: The median for Exercise is 2.5 hours, and the median for Internet Usage is 6 hours. So the median for Internet Usage is greater than the median for Exercise.
- Range comparison: The range for Exercise is 12 hours (from the problem statement: "the range is 12 hours" for Exercise), and the range for Internet Usage is 10 hours. So the range for Internet Usage is less than the range for Exercise.

Snap & solve any problem in the app
Get step-by-step solutions on Sovi AI
Photo-based solutions with guided steps
Explore more problems and detailed explanations
The median for the internet usage is 6 hours and the range is 10 hours. The median for internet usage is greater than the median for exercise, and the range for internet usage is less than the range for exercise.