QUESTION IMAGE
Question
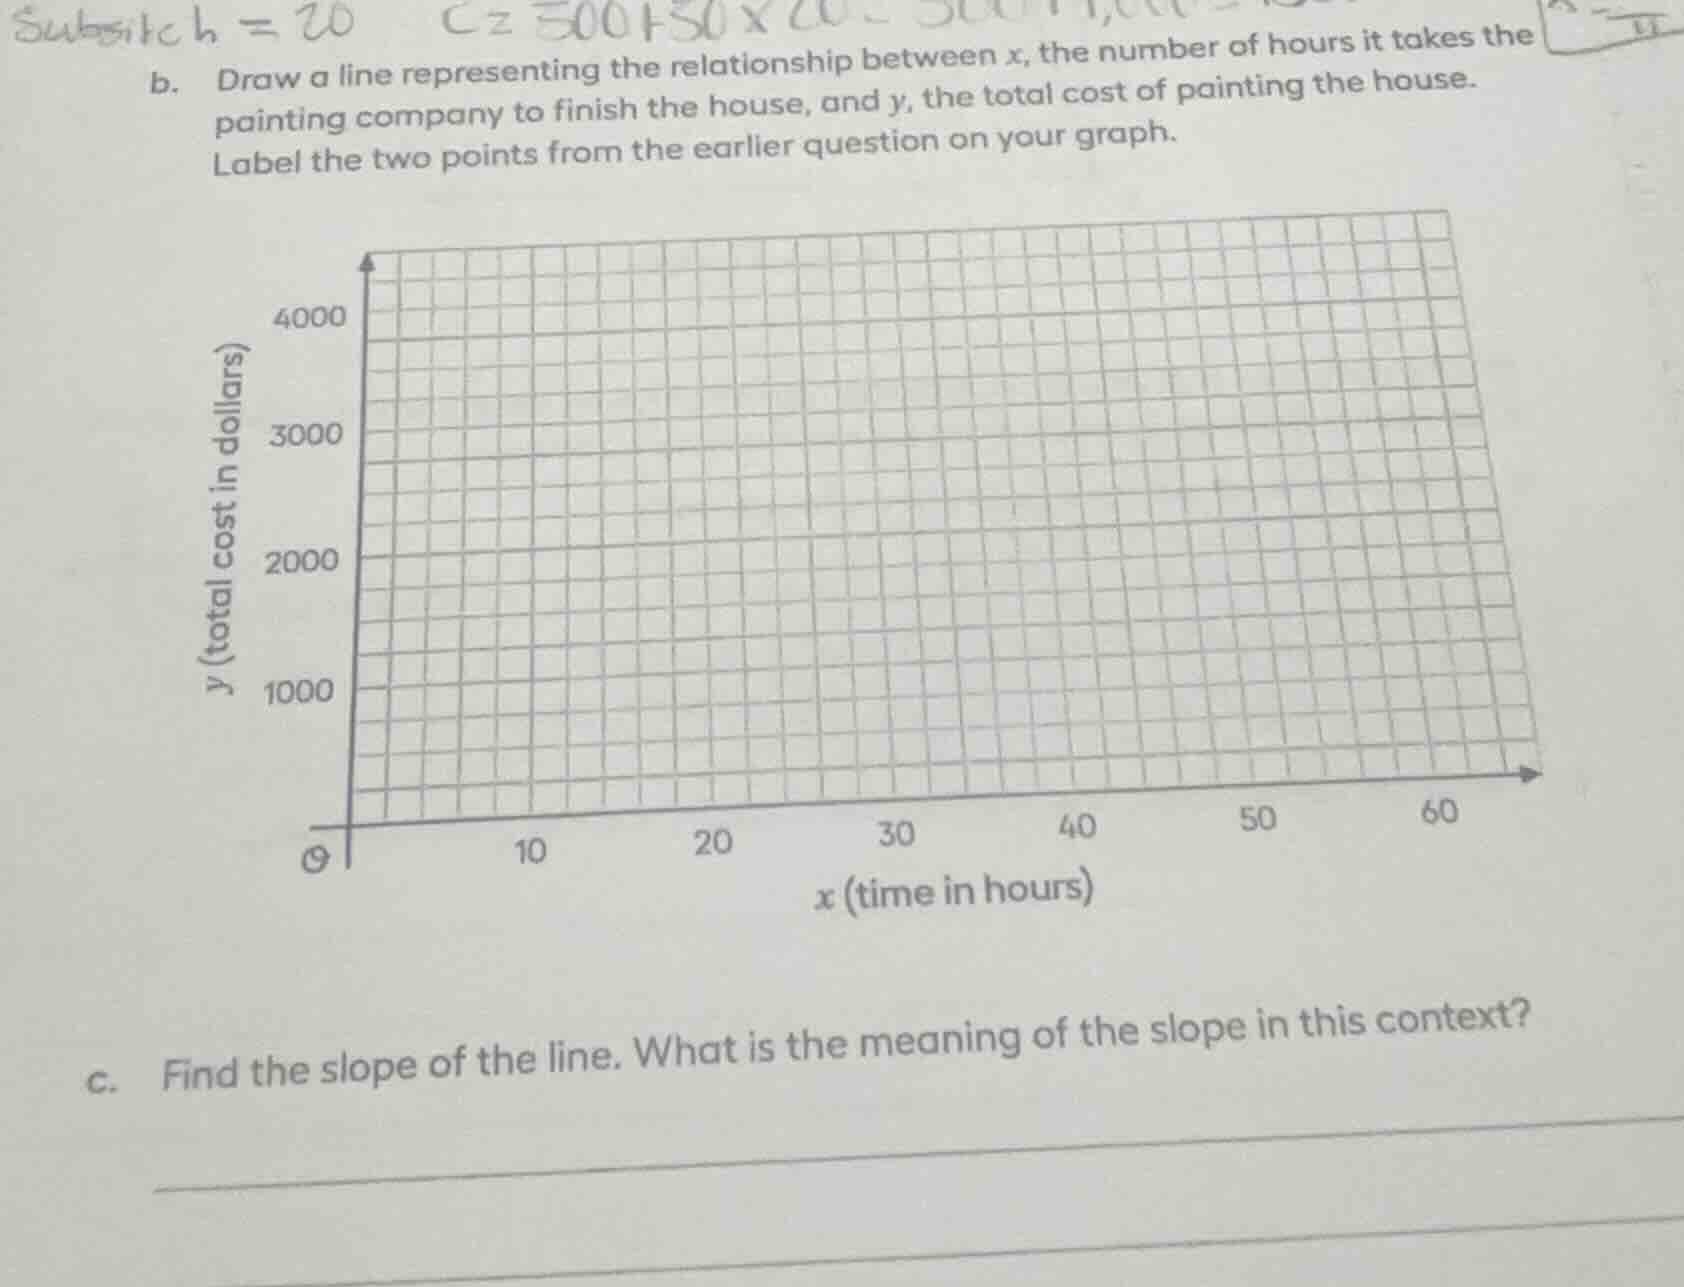
b. draw a line representing the relationship between x, the number of hours it takes the painting company to finish the house, and y, the total cost of painting the house.
label the two points from the earlier question on your graph.
c. find the slope of the line. what is the meaning of the slope in this context?
Step1: Identify cost function
From the handwritten note, the cost function is $y = 500 + 50x$
Step2: Find two points on the line
For $x=0$: $y = 500 + 50(0) = 500$, so point $(0, 500)$.
For $x=20$: $y = 500 + 50(20) = 1500$, so point $(20, 1500)$.
Step3: Calculate the slope
Use slope formula $m=\frac{y_2-y_1}{x_2-x_1}$
$m=\frac{1500-500}{20-0}=\frac{1000}{20}=50$
Step4: Interpret the slope
The slope equals the hourly cost.

Snap & solve any problem in the app
Get step-by-step solutions on Sovi AI
Photo-based solutions with guided steps
Explore more problems and detailed explanations
For part b: Plot the points $(0, 500)$ and $(20, 1500)$ on the graph, then draw a straight line passing through them.
For part c: The slope of the line is 50. In this context, it means the painting company charges $50 per hour for their services, in addition to a fixed $500 fee.