QUESTION IMAGE
Question
dt11.schoology.com/assignment/8172011210/assessment
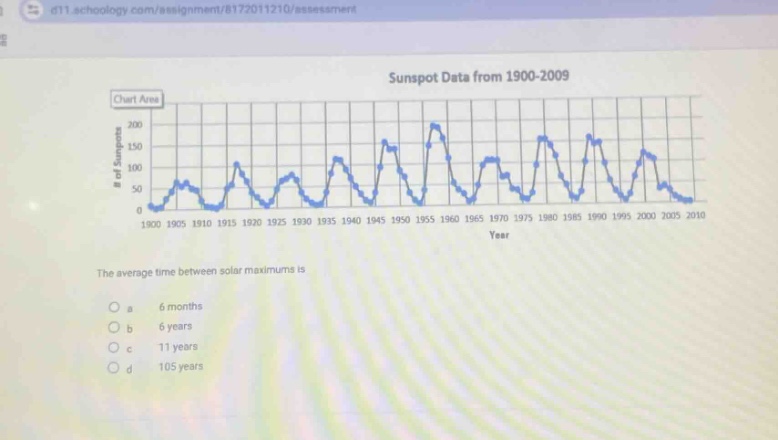
sunspot data from 1900 - 2009
the average time between solar maximums is
a 6 months
b 6 years
c 11 years
d 105 years
To determine the average time between solar maximums, we analyze the sunspot data graph. Solar maximums occur at peaks in sunspot numbers. By observing the years of successive peaks (e.g., around 1905, 1915, 1925, etc.), we calculate the time between them. The typical solar cycle, which is the time between solar maximums, is known to be approximately 11 years. Comparing with the options, 11 years (option c) matches this typical cycle.

Snap & solve any problem in the app
Get step-by-step solutions on Sovi AI
Photo-based solutions with guided steps
Explore more problems and detailed explanations
c. 11 years