QUESTION IMAGE
Question
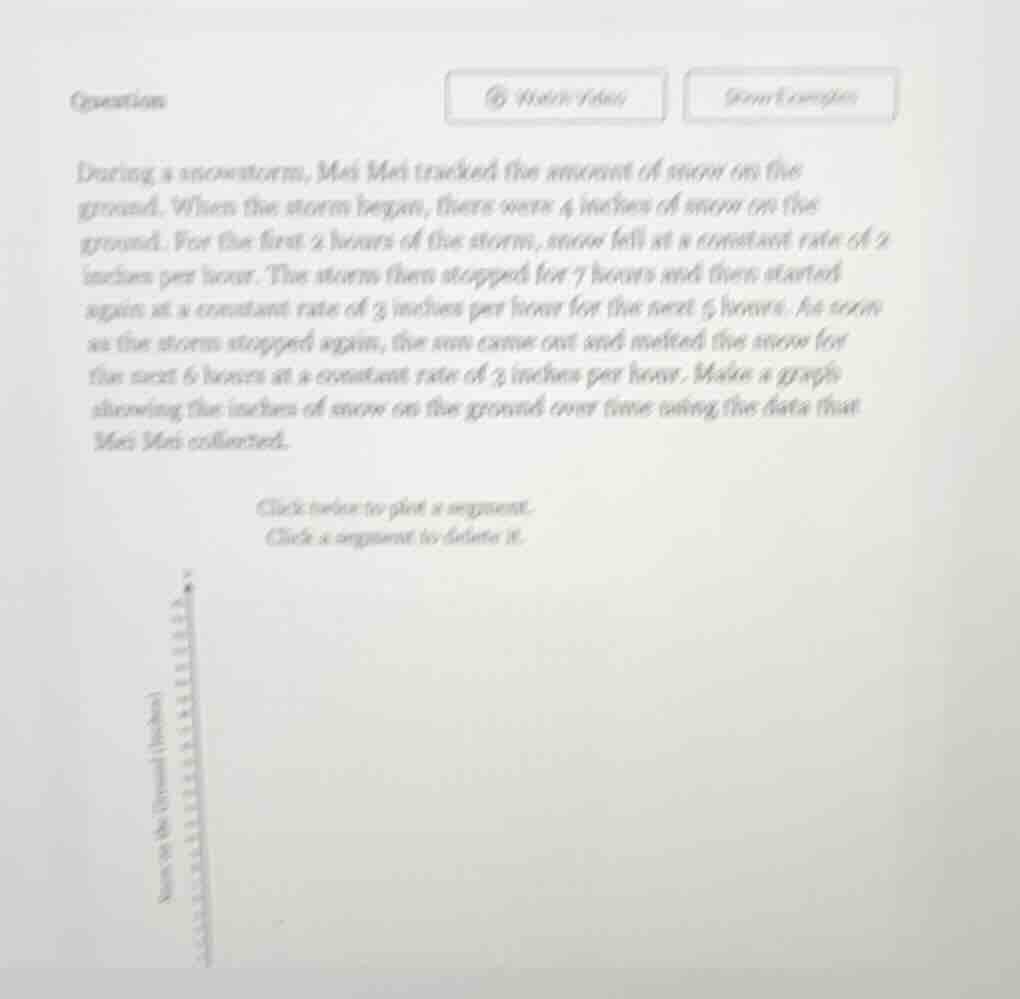
during a snowstorm, mei mei tracked the amount of snow on the ground. when the storm began, there were 4 inches of snow on the ground. for the first 2 hours of the storm, snow fell at a constant rate of 2 inches per hour. the storm then stopped for 7 hours and then started again at a constant rate of 2 inches per hour for the next 5 hours. as soon as the storm stopped again, the sun came out and melted the snow for the next 6 hours at a constant rate of 2 inches per hour. make a graph showing the inches of snow on the ground over time using the data that mei mei collected.
click twice to plot a segment.
click a segment to delete it.
Step1: Initial Snow and First Storm
Start at (0, 4) (time 0, 4 inches). For 2 hours, rate 2 in/h. Snow after 2h: \(4 + 2\times2 = 8\). So segment from (0,4) to (2,8).
Step2: Storm Stops
Storm stops for 7h (time 2 to 2+7=9). Snow remains 8. Segment from (2,8) to (9,8).
Step3: Second Storm
Storm restarts, rate 2 in/h for 5h (time 9 to 9+5=14). Snow: \(8 + 2\times5 = 18\). Segment from (9,8) to (14,18).
Step4: Melting
Sun melts at 3 in/h for 6h (time 14 to 14+6=20). Snow: \(18 - 3\times6 = 0\). Segment from (14,18) to (20,0).

Snap & solve any problem in the app
Get step-by-step solutions on Sovi AI
Photo-based solutions with guided steps
Explore more problems and detailed explanations
To graph:
- Plot (0, 4) to (2, 8) (rising line).
- Plot (2, 8) to (9, 8) (horizontal line).
- Plot (9, 8) to (14, 18) (rising line).
- Plot (14, 18) to (20, 0) (falling line).