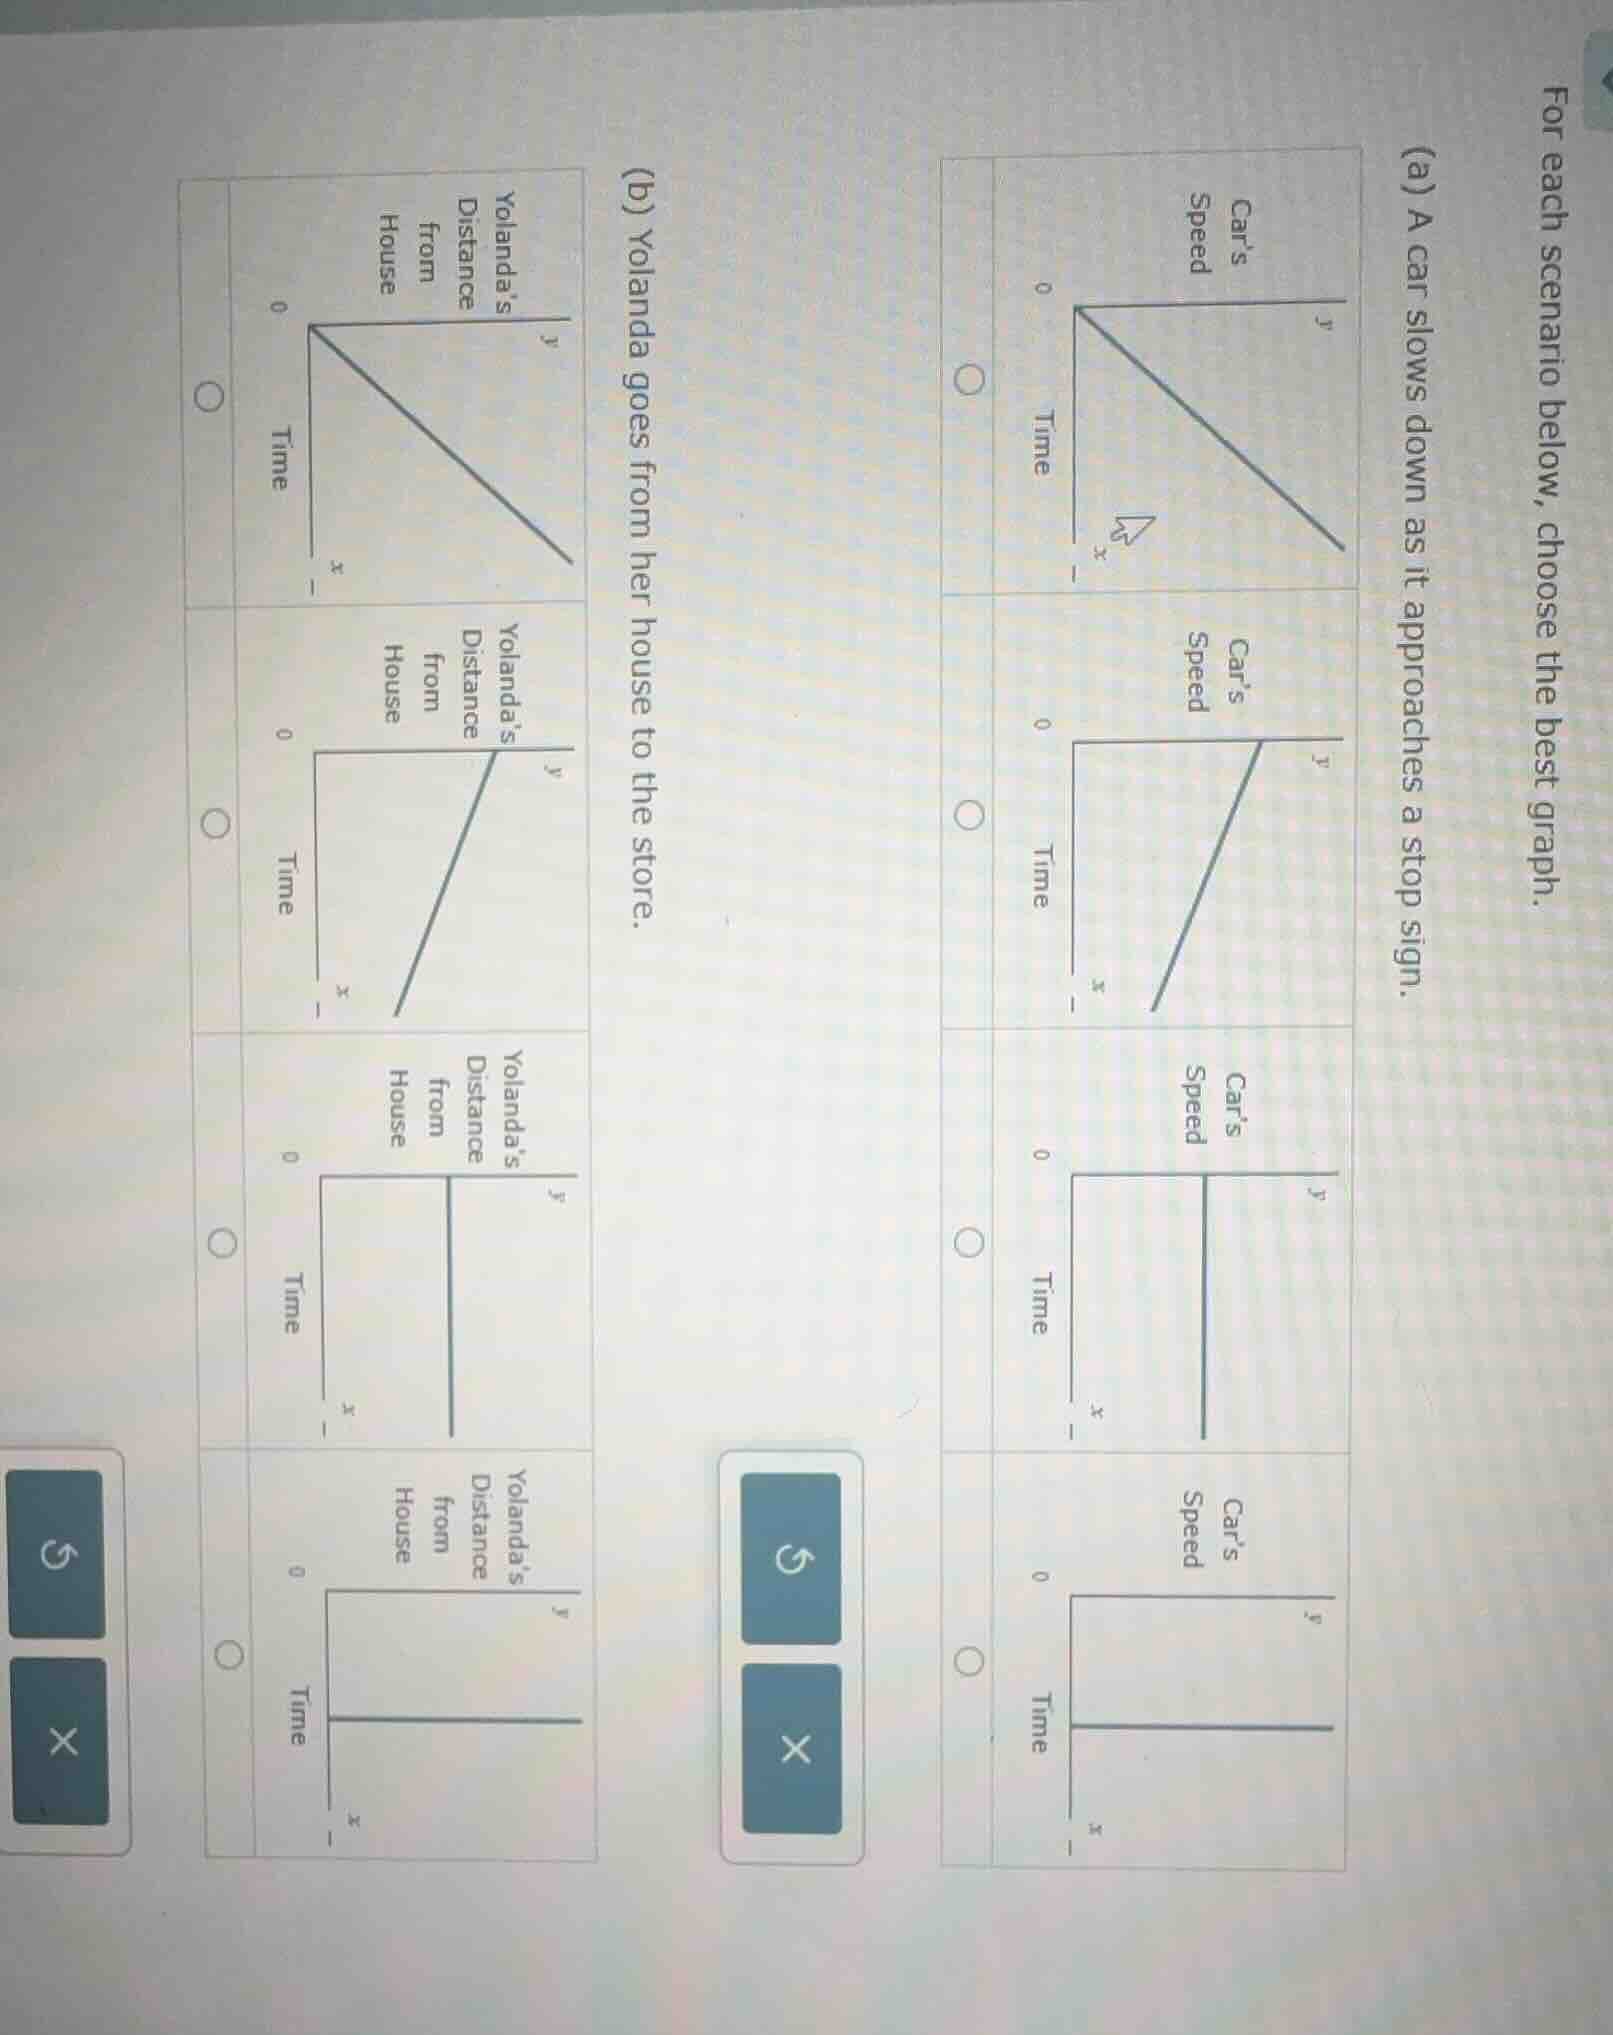
QUESTION IMAGE
Question
for each scenario below, choose the best graph.
(a) a car slows down as it approaches a stop sign.
(b) yolanda goes from her house to the store.
Part (a)
Step 1: Analyze the scenario
A car slowing down as it approaches a stop sign means the car's speed is decreasing over time. So we need a graph where the \( y \)-axis (speed) decreases as the \( x \)-axis (time) increases.
Step 2: Evaluate the graphs
- The first graph (top - left of part (a)) has a line with a negative slope, meaning speed (\( y \)) decreases as time (\( x \)) increases. This matches the scenario.
- The second graph has a positive slope (speed increasing), which is not correct.
- The third graph has a vertical line (speed constant, which would be a horizontal line if speed is constant, but this is vertical, which doesn't make sense for speed - time; also speed isn't changing).
- The fourth graph has a horizontal line (speed constant), which is not slowing down.
Step 1: Analyze the scenario
Yolanda goes from her house to the store, so her distance from the house should increase over time (as she moves away from the house towards the store).
Step 2: Evaluate the graphs
- The first graph (top - left of part (b)) has a line with positive slope starting at (0,0), but wait, no: wait, the \( y \)-axis is "Yolanda's Distance from House". At time 0, her distance from the house is 0 (she is at the house). As time (\( x \)) increases, her distance (\( y \)) should increase. Wait, no: the first graph in part (b) (top - left) has a line going from (0,0) with positive slope? Wait, no, looking at the graphs:
Wait, the second graph in part (b) (second from top) has a horizontal line first (distance constant, meaning she is not moving) and then a positive slope (distance increasing). But no, when she starts from the house, at time 0, distance from house is 0. As she moves to the store, distance from house should increase over time. So the graph should have \( y \) (distance) increasing as \( x \) (time) increases, starting from (0,0). Wait, the second graph in part (b) (second row) has a horizontal line (distance constant) first, then a positive slope. But the correct graph should have distance increasing continuously from time 0. Wait, maybe I misread. Wait, the first graph in part (b) (top - left) has a line with positive slope starting at (0,0)? Wait, no, the first graph in part (b) (top - left) has a line going from (0,0) with positive slope? Wait, no, the \( y \)-axis is distance from house. At time 0, distance is 0. As time increases, distance should increase. So the graph with a line that has positive slope, starting at (0,0) and increasing as time increases. Wait, the second graph in part (b) (second row) has a horizontal line (distance constant) first, then a positive slope. But the correct graph is the second graph (second row) of part (b)? Wait, no: wait, the first graph in part (b) (top - left) has a line with positive slope? Wait, no, let's re - examine:
Wait, the graphs in part (b):
- First graph: line from (0,0) with positive slope? Wait, no, the first graph in part (b) (top - left) has a line with positive slope? Wait, no, the \( x \)-axis is time, \( y \)-axis is distance from house. At time 0, distance is 0. As time increases, distance should increase. So the graph where \( y \) (distance) increases as \( x \) (time) increases. The second graph in part (b) (second row) has a horizontal line (distance constant) first, then a positive slope. But the correct graph is the second graph (second row) of part (b)? Wait, no, maybe the second graph (second row) is when she starts moving after some time? No, the problem says "Yolanda goes from her house to the store", so she starts at time 0 (or as soon as time starts) moving, so distance from house should increase over time. So the graph with a line that has positive slope, starting at (0,0) and increasing. Wait, the second graph in part (b) (second row) has a horizontal line (distance constant) first, then a positive slope. But the first graph in part (b) (top - left) has a line with positive slope starting at (0,0)? Wait, maybe I made a mistake. Wait, the second graph in part (b) (second row) has a horizontal line (distance not changing, so she is not moving) and then a positive slope (she starts moving). But the problem says "Yolanda goes from her house to the store", so she should start moving at time 0, so distance from house should increase from time 0. So the correct graph is the second graph (second row) of part (b)? No, wait, the…

Snap & solve any problem in the app
Get step-by-step solutions on Sovi AI
Photo-based solutions with guided steps
Explore more problems and detailed explanations
The first graph (top - left) of part (a) (with the line having negative slope, showing speed decreasing over time)