QUESTION IMAGE
Question
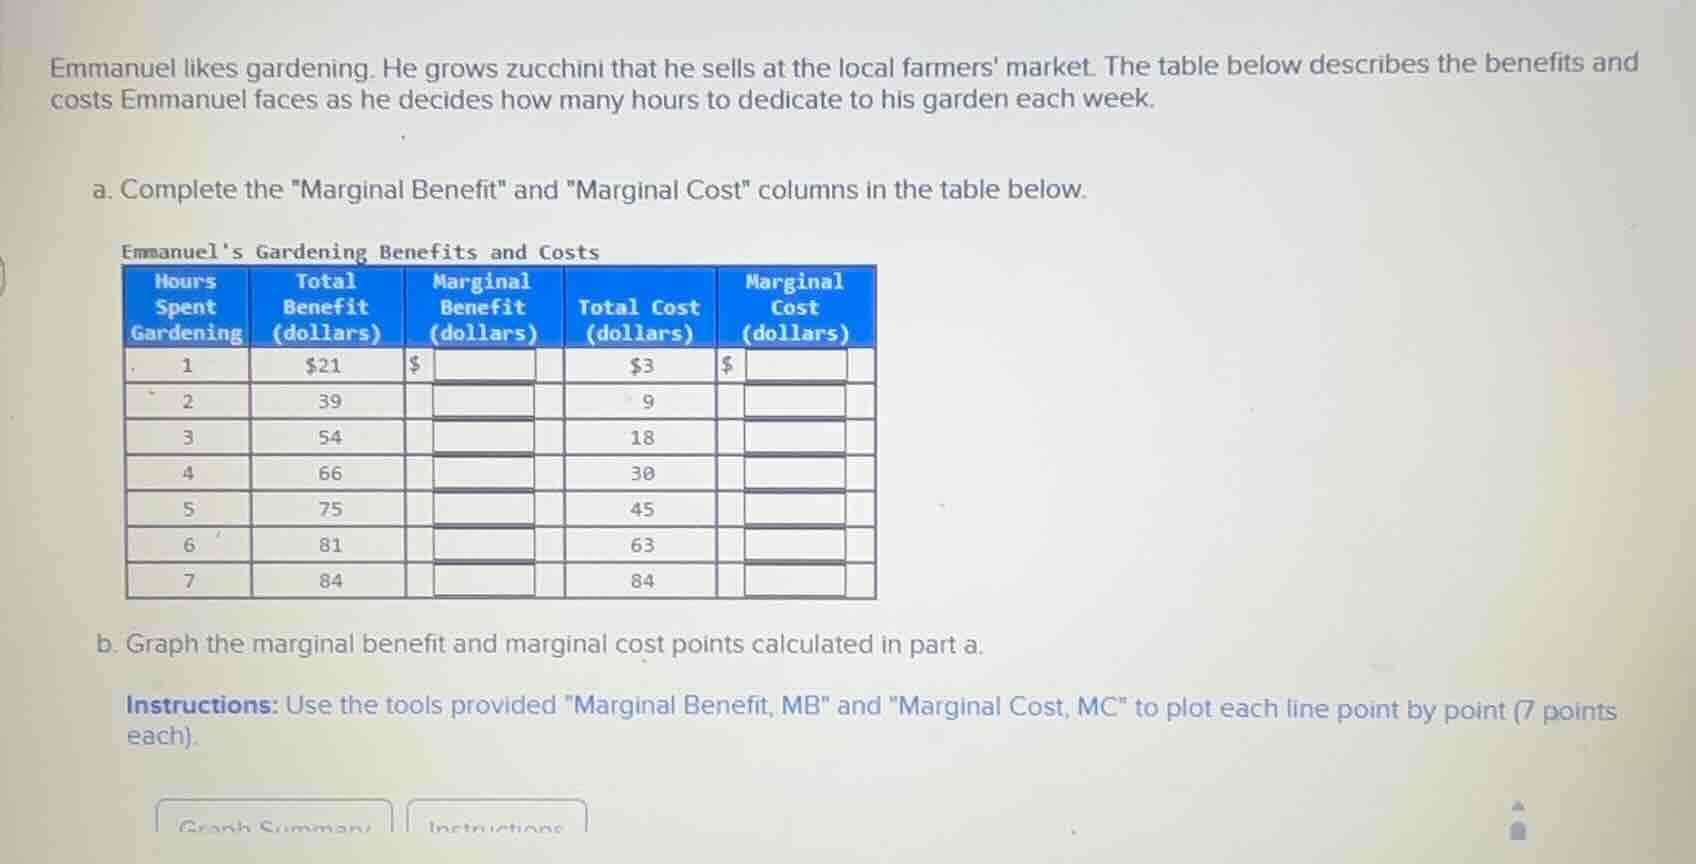
emmanuel likes gardening. he grows zucchini that he sells at the local farmers market. the table below describes the benefits and costs emmanuel faces as he decides how many hours to dedicate to his garden each week.
a. complete the \marginal benefit\ and \marginal cost\ columns in the table below.
emmanuels gardening benefits and costs
hours spent gardening | total benefit (dollars) | marginal benefit (dollars) | total cost (dollars) | marginal cost (dollars)
1 | $21 | $ | $3 | $
2 | 39 | | 9 |
3 | 54 | | 18 |
4 | 66 | | 30 |
5 | 75 | | 45 |
6 | 81 | | 63 |
7 | 84 | | 84 |
b. graph the marginal benefit and marginal cost points calculated in part a.
instructions: use the tools provided \marginal benefit, mb\ and \marginal cost, mc\ to plot each line point by point (7 points each).
Step1: Calculate Marginal Benefit (MB)
Marginal Benefit = Current Total Benefit - Previous Total Benefit
- For 1 hour: $\$21 - \$0 = \$21$
- For 2 hours: $\$39 - \$21 = \$18$
- For 3 hours: $\$54 - \$39 = \$15$
- For 4 hours: $\$66 - \$54 = \$12$
- For 5 hours: $\$75 - \$66 = \$9$
- For 6 hours: $\$81 - \$75 = \$6$
- For 7 hours: $\$84 - \$81 = \$3$
Step2: Calculate Marginal Cost (MC)
Marginal Cost = Current Total Cost - Previous Total Cost
- For 1 hour: $\$3 - \$0 = \$3$
- For 2 hours: $\$9 - \$3 = \$6$
- For 3 hours: $\$18 - \$9 = \$9$
- For 4 hours: $\$30 - \$18 = \$12$
- For 5 hours: $\$45 - \$30 = \$15$
- For 6 hours: $\$63 - \$45 = \$18$
- For 7 hours: $\$84 - \$63 = \$21$

Snap & solve any problem in the app
Get step-by-step solutions on Sovi AI
Photo-based solutions with guided steps
Explore more problems and detailed explanations
Completed Table:
| Hours Spent Gardening | Total Benefit (dollars) | Marginal Benefit (dollars) | Total Cost (dollars) | Marginal Cost (dollars) |
|---|---|---|---|---|
| 2 | $\$39$ | $\$18$ | $\$9$ | $\$6$ |
| 3 | $\$54$ | $\$15$ | $\$18$ | $\$9$ |
| 4 | $\$66$ | $\$12$ | $\$30$ | $\$12$ |
| 5 | $\$75$ | $\$9$ | $\$45$ | $\$15$ |
| 6 | $\$81$ | $\$6$ | $\$63$ | $\$18$ |
| 7 | $\$84$ | $\$3$ | $\$84$ | $\$21$ |
Graphing Guidance (Part b):
To plot the lines:
- Place "Hours Spent Gardening" on the x-axis, and "Marginal Benefit/Cost (dollars)" on the y-axis.
- For the Marginal Benefit (MB) line, plot the points: (1, 21), (2, 18), (3, 15), (4, 12), (5, 9), (6, 6), (7, 3) and connect them.
- For the Marginal Cost (MC) line, plot the points: (1, 3), (2, 6), (3, 9), (4, 12), (5, 15), (6, 18), (7, 21) and connect them.