QUESTION IMAGE
Question
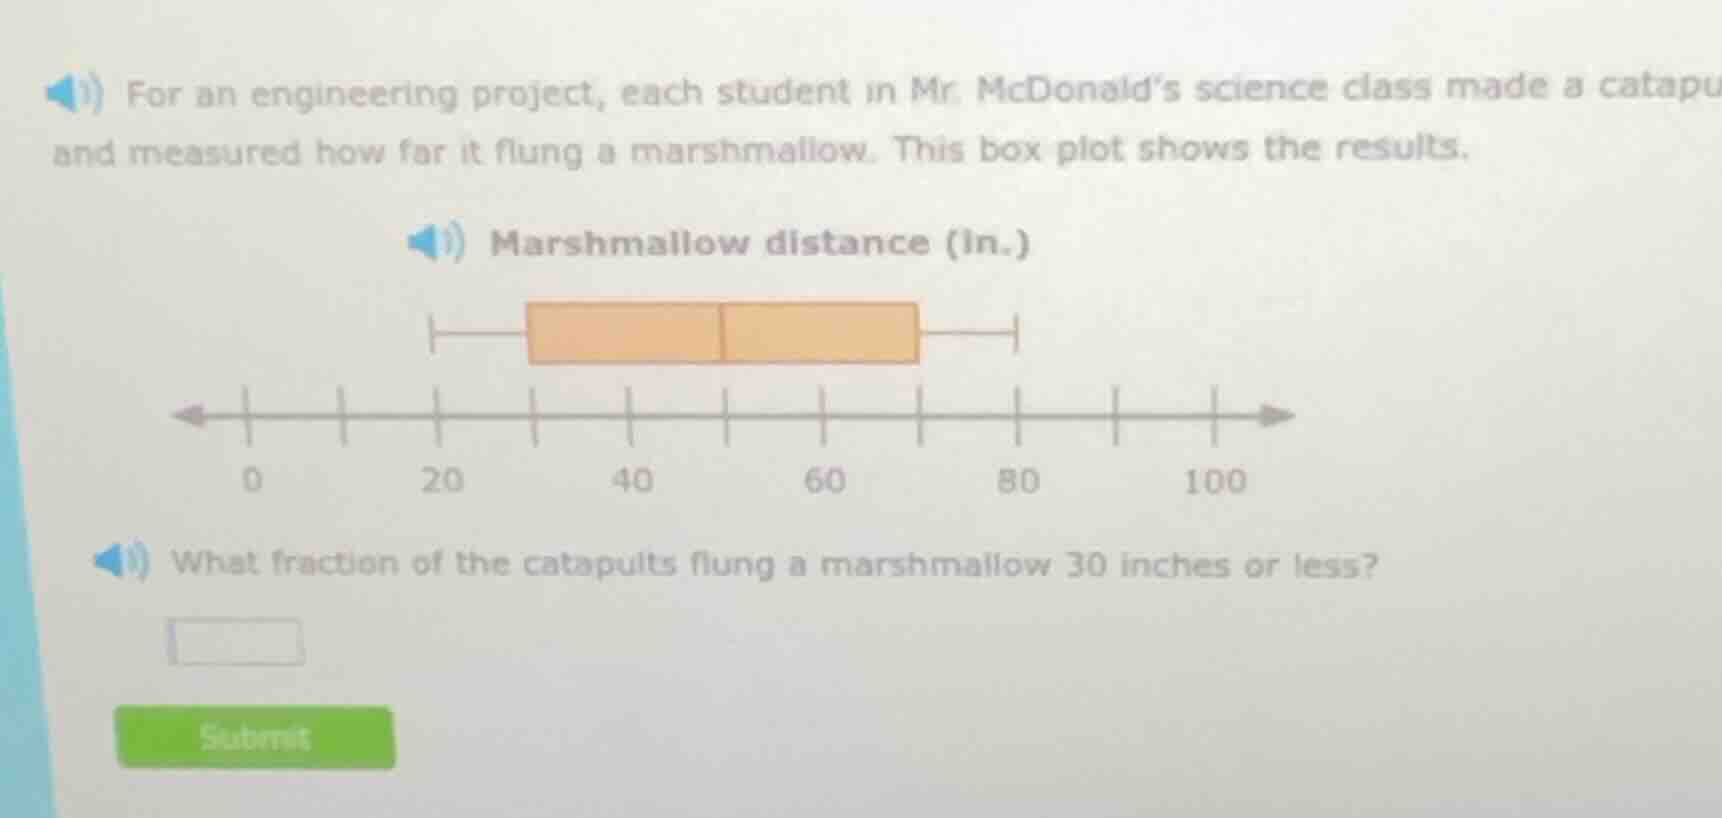
for an engineering project, each student in mr. mcdonald’s science class made a catapu and measured how far it flung a marshmallow. this box plot shows the results. marshmallow distance (in.) what fraction of the catapults flung a marshmallow 30 inches or less?
Step1: Recall box plot properties
In a box plot, the data is divided into four equal parts (quartiles). The leftmost whisker to the first quartile ($Q_1$) represents the lowest 25% of the data, $Q_1$ to the median is the next 25%, median to $Q_3$ is the next 25%, and $Q_3$ to the rightmost whisker is the highest 25%.
Looking at the number line, the first vertical line (start of the left whisker) is at 20? Wait, no, let's check the scale. Wait, the x - axis has marks at 0, 20, 40, 60, 80, 100. Wait, the left whisker starts at 20? Wait, no, the first vertical line (the minimum) is at 20? Wait, no, the box plot: the left whisker is from the minimum to $Q_1$, the box is from $Q_1$ to $Q_3$, and the right whisker is from $Q_3$ to maximum.
Wait, the question is about 30 inches or less. Wait, the minimum is at 20? Wait, no, let's re - examine. Wait, the leftmost vertical line (the minimum) is at 20? Wait, no, the x - axis: 0, 20, 40, 60, 80, 100. Wait, the left whisker: the first vertical line (minimum) is at 20? Wait, no, maybe the minimum is at 20, $Q_1$ is at 30? Wait, no, the problem is to find the fraction of data 30 inches or less.
In a box plot, the quartiles divide the data into four groups of 25% each. Wait, if the first quartile ($Q_1$) is at 30, then the data at or below $Q_1$ is 25% of the data, because $Q_1$ is the 25th percentile. So the fraction of data 30 inches or less is $\frac{1}{4}$ (since 25% is $\frac{1}{4}$).
Wait, let's think again. A box plot shows the five - number summary: minimum, $Q_1$, median, $Q_3$, maximum. The data is split into four equal parts (quartiles), each representing 25% of the data. So the data from minimum to $Q_1$ is 25% (or $\frac{1}{4}$) of the data, $Q_1$ to median is 25%, median to $Q_3$ is 25%, and $Q_3$ to maximum is 25%.
If 30 is at $Q_1$ (the first quartile), then the fraction of data 30 inches or less is the fraction of data from minimum to $Q_1$, which is $\frac{1}{4}$ (25% of the data).
Step2: Determine the fraction
Since the data is divided into four quartiles, each quartile represents $\frac{1}{4}$ of the data. The values 30 inches or less are in the first quartile (the lowest 25% of the data). So the fraction is $\frac{1}{4}$.

Snap & solve any problem in the app
Get step-by-step solutions on Sovi AI
Photo-based solutions with guided steps
Explore more problems and detailed explanations
$\frac{1}{4}$