QUESTION IMAGE
Question
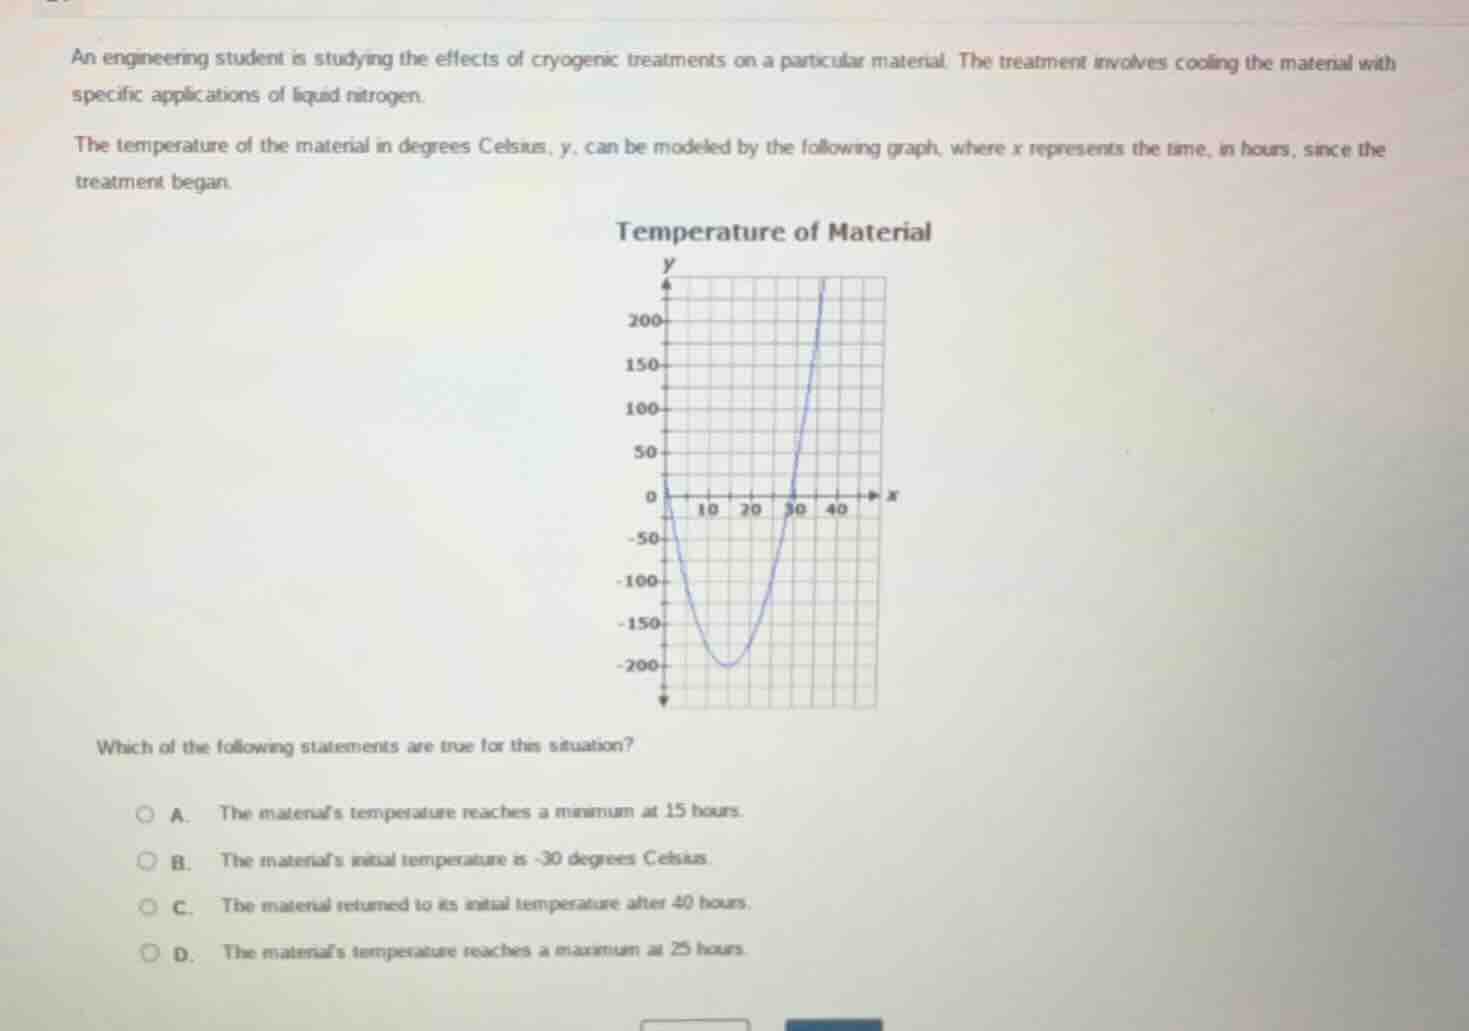
an engineering student is studying the effects of cryogenic treatments on a particular material. the treatment involves cooling the material with specific applications of liquid nitrogen.
the temperature of the material in degrees celsius, y, can be modeled by the following graph, where x represents the time, in hours, since the treatment began.
temperature of material
graph of a parabola - shaped curve with x - axis (time in hours) and y - axis (temperature in degrees celsius)
which of the following statements are true for this situation?
a. the material’s temperature reaches a minimum at 15 hours.
b. the material’s initial temperature is - 30 degrees celsius.
c. the material returned to its initial temperature after 40 hours.
d. the material’s temperature reaches a maximum at 25 hours.
- Option A: The graph is a parabola opening upwards, so it has a minimum. The vertex (minimum point) appears at \( x = 15 \) (since the axis of symmetry is around \( x = 15 \) between \( x = 0 \) and \( x = 30 \)), so the temperature reaches a minimum at 15 hours. This is true.
- Option B: Initial temperature is at \( x = 0 \). From the graph, at \( x = 0 \), \( y \) (temperature) is 0 (not -30), so this is false.
- Option C: Initial temperature is \( 0^\circ \text{C} \) (at \( x = 0 \)). At \( x = 40 \), the temperature is much higher (around \( 200^\circ \text{C} \)), so it does not return to initial temperature. False.
- Option D: The parabola opens upwards, so it has a minimum, not a maximum at \( x = 25 \). False.

Snap & solve any problem in the app
Get step-by-step solutions on Sovi AI
Photo-based solutions with guided steps
Explore more problems and detailed explanations
A. The material’s temperature reaches a minimum at 15 hours.