QUESTION IMAGE
Question
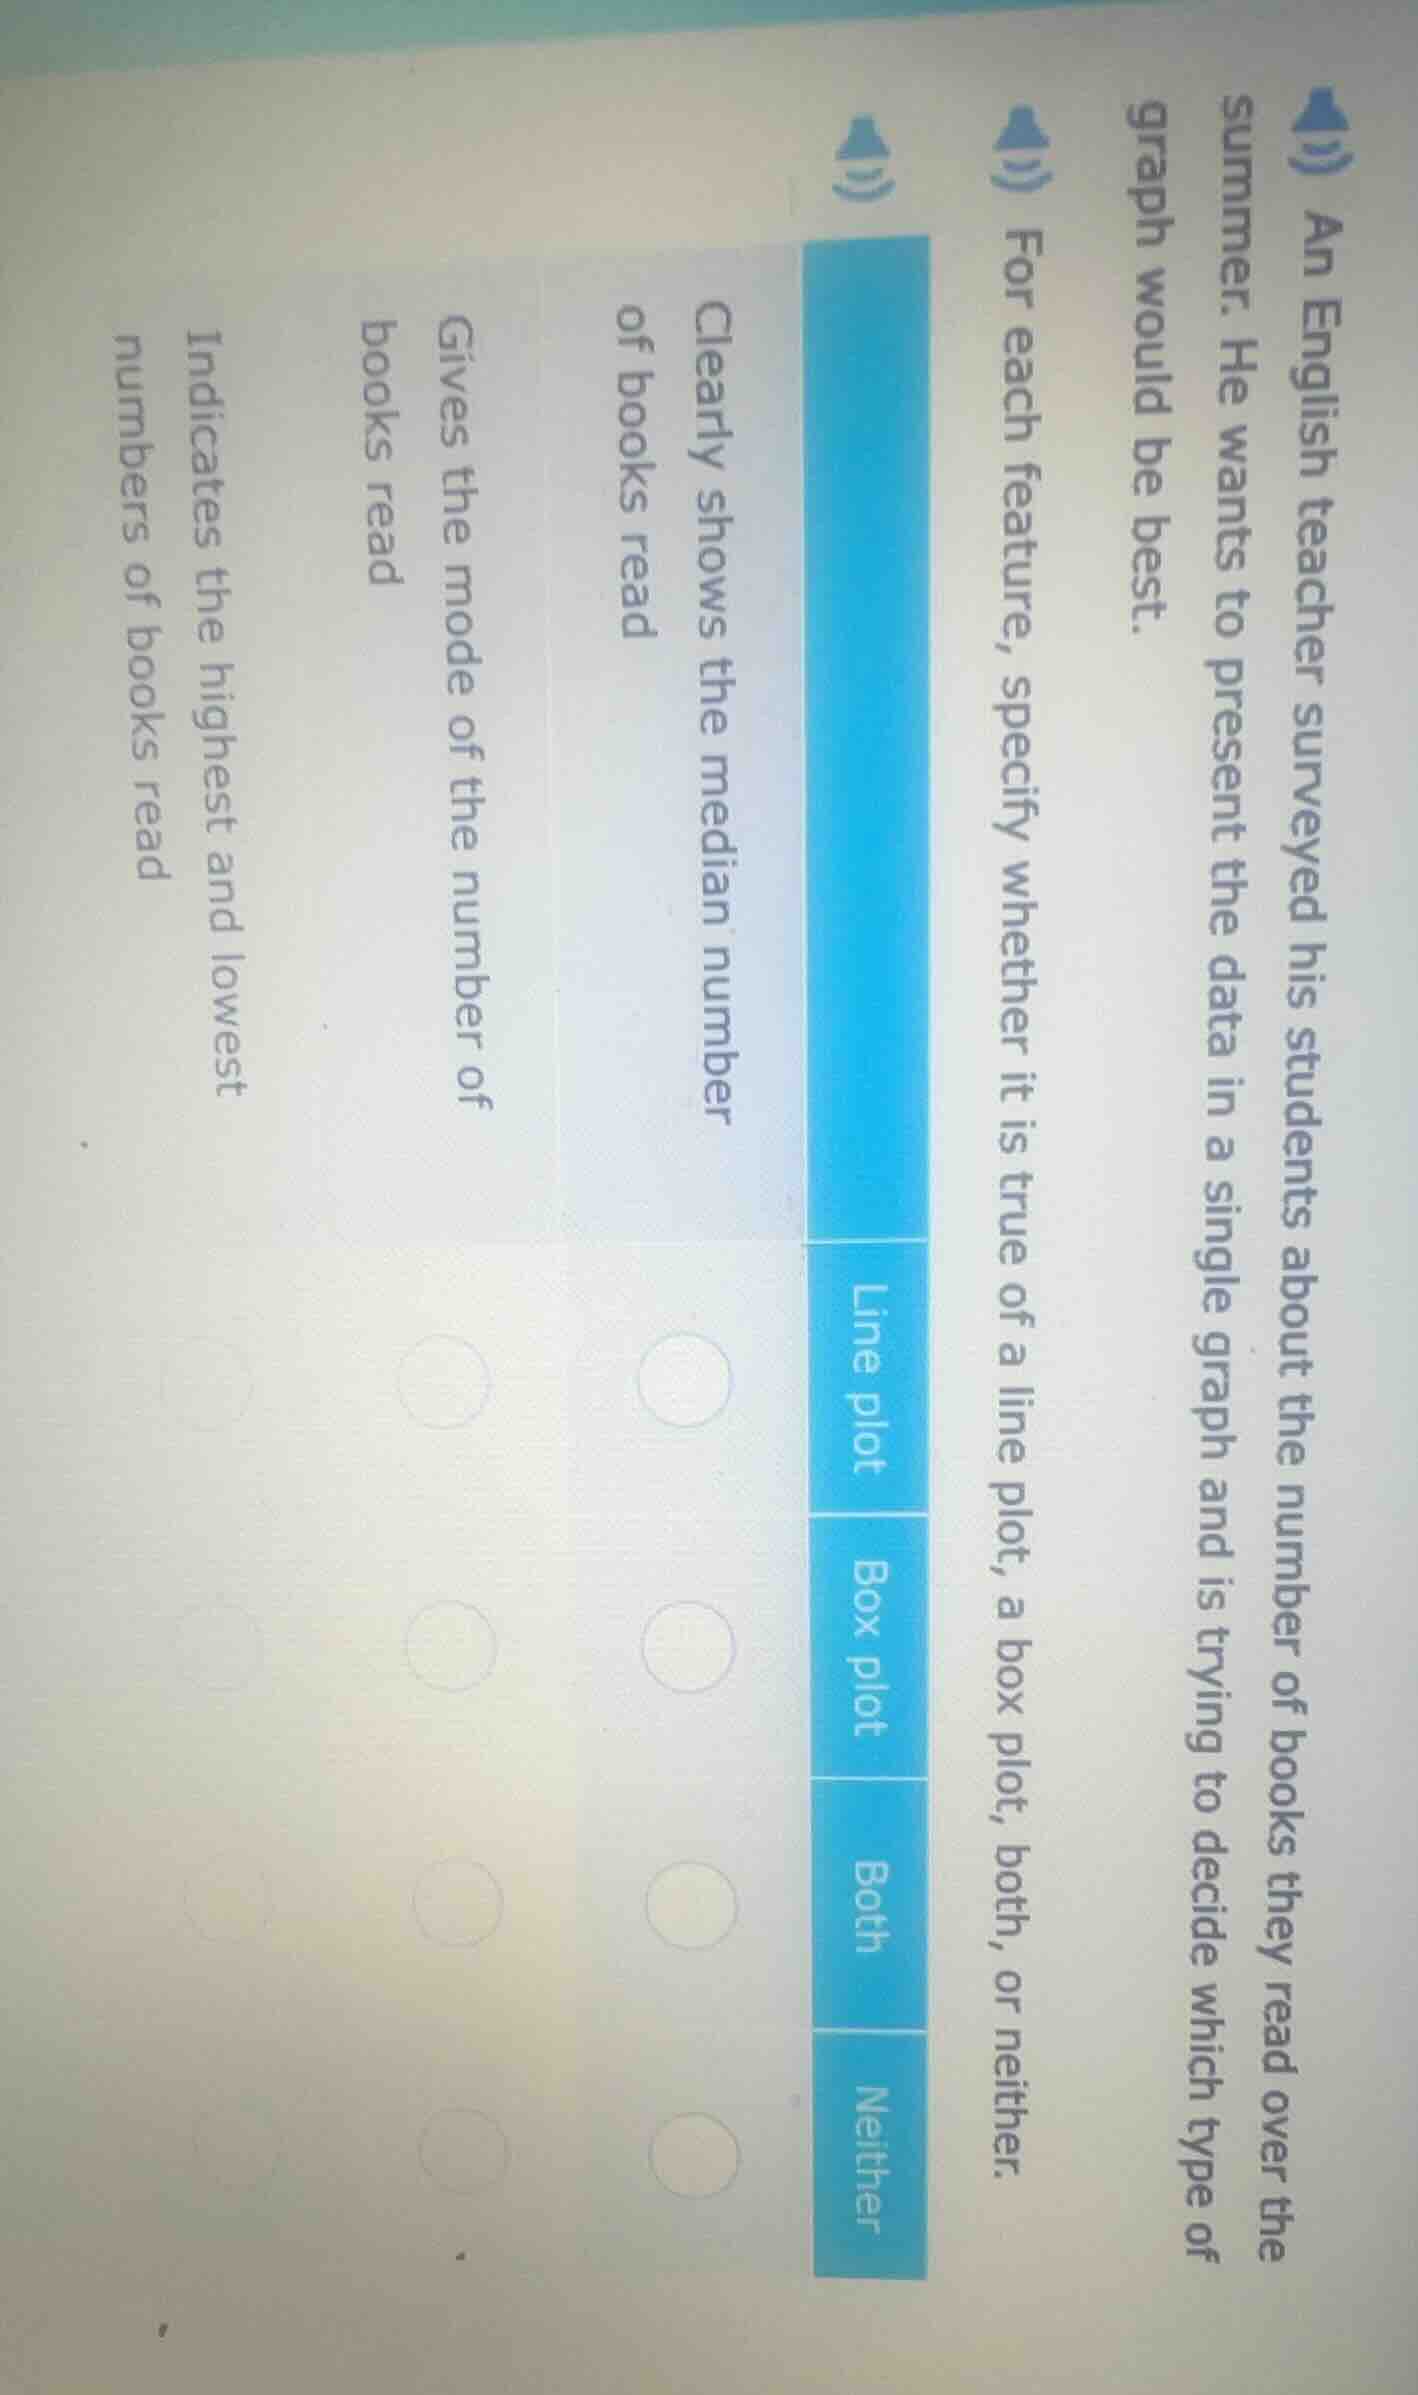
an english teacher surveyed his students about the number of books they read over the summer. he wants to present the data in a single graph and is trying to decide which type of graph would be best. for each feature, specify whether it is true of a line plot, a box plot, both, or neither. clearly shows the median number of books read gives the mode of the number of books read indicates the highest and lowest numbers of books read
Response
1. "Clearly shows the median number of books read"
- Line plot: A line plot shows the frequency of data points but does not directly show the median.
- Box plot: A box plot has a line (the median) inside the box, so it clearly shows the median.
- Both: Since line plot does not show median, this is not correct.
- Neither: Since box plot shows median, this is not correct.
So for this row, the answer is Box plot.
2. "Gives the mode of the number of books read"
- Line plot: A line plot (or dot plot) shows the frequency of each data point, so the data point with the highest frequency (mode) is easily identifiable (the one with the most dots).
- Box plot: A box plot shows median, quartiles, and outliers, but not the mode directly.
- Both: Since box plot does not give mode, this is not correct.
- Neither: Since line plot gives mode, this is not correct.
So for this row, the answer is Line plot.
3. "Indicates the highest and lowest numbers of books read"
- Line plot: The minimum and maximum values can be seen as the left - most and right - most data points (dots) in a line plot.
- Box plot: A box plot has whiskers that extend to the minimum and maximum values (excluding outliers, but still indicates the overall range).
- Both: Both line plot (through the range of dots) and box plot (through whiskers) can indicate the highest and lowest values.
- Neither: Since both can indicate, this is not correct.
So for this row, the answer is Both.

Snap & solve any problem in the app
Get step-by-step solutions on Sovi AI
Photo-based solutions with guided steps
Explore more problems and detailed explanations
s:
- "Clearly shows the median number of books read": Box plot
- "Gives the mode of the number of books read": Line plot
- "Indicates the highest and lowest numbers of books read": Both