QUESTION IMAGE
Question
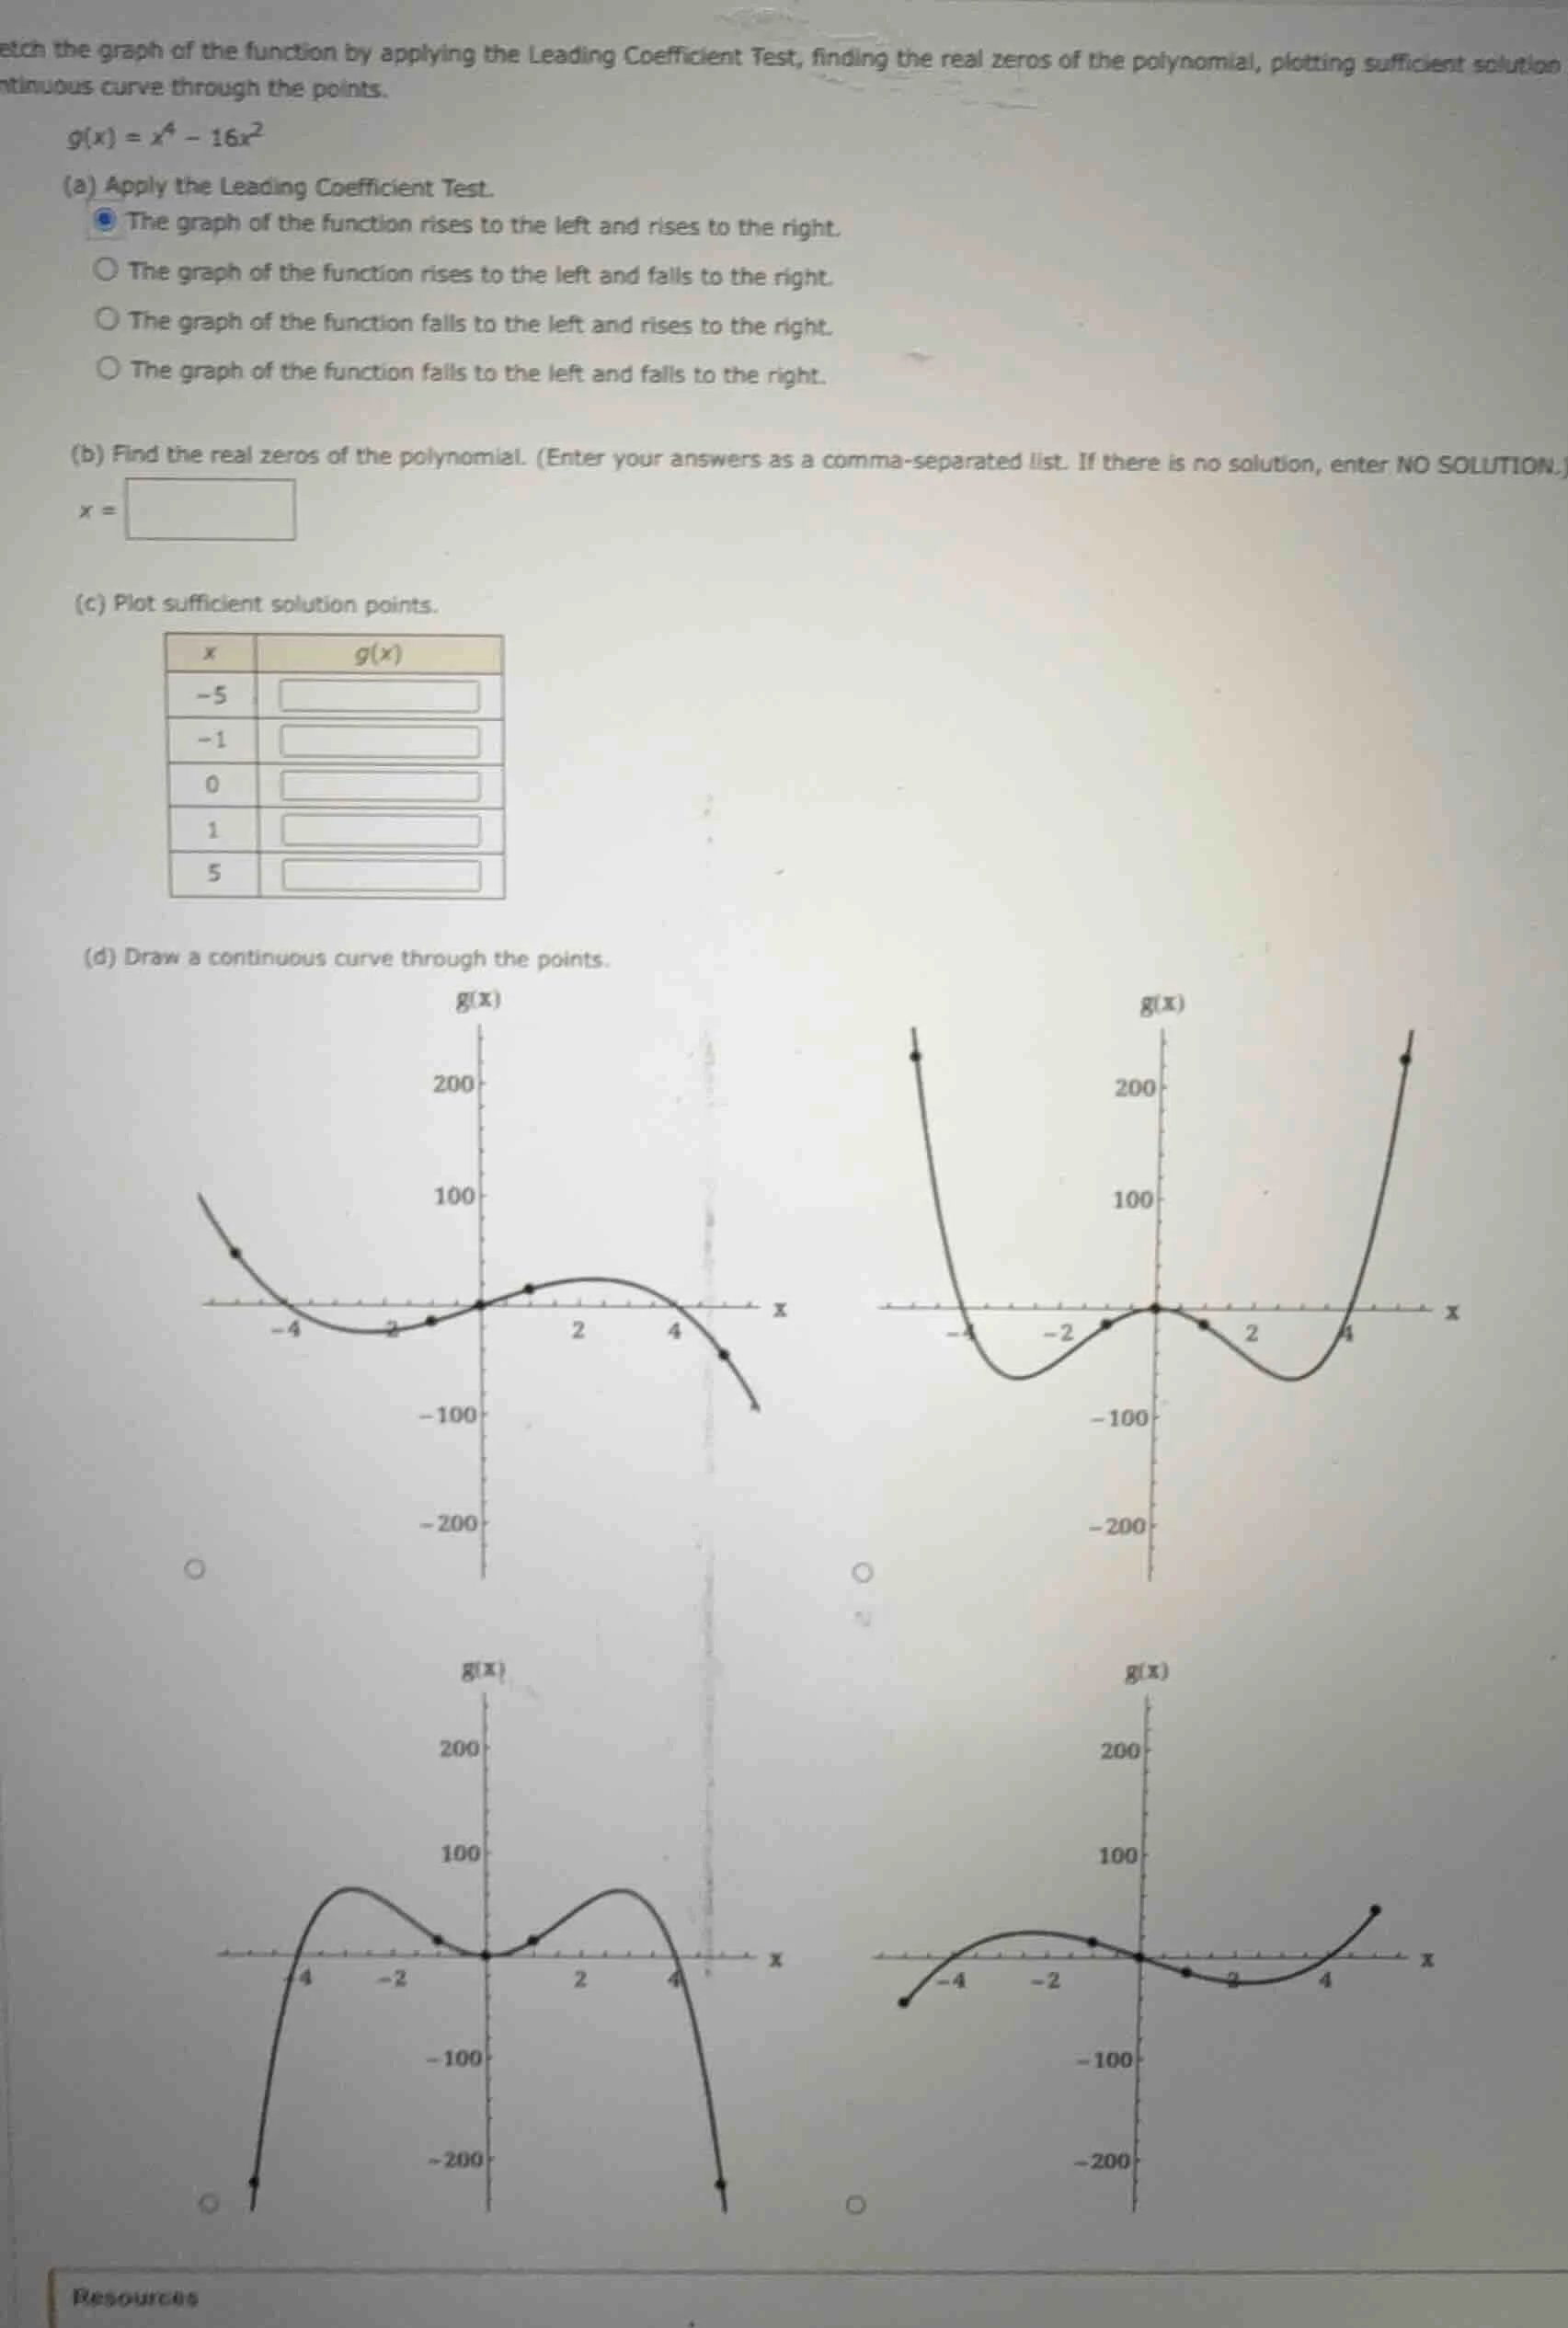
etch the graph of the function by applying the leading coefficient test, finding the real zeros of the polynomial, plotting sufficient solution ntinuous curve through the points.
$g(x) = x^4 - 16x^2$
(a) apply the leading coefficient test.
the graph of the function rises to the left and rises to the right.
the graph of the function rises to the left and falls to the right.
the graph of the function falls to the left and rises to the right.
the graph of the function falls to the left and falls to the right.
(b) find the real zeros of the polynomial. (enter your answers as a comma - separated list. if there is no solution, enter no solution.)
$x = $
(c) plot sufficient solution points.
| $x$ | $g(x)$ |
|---|---|
| $-1$ | |
| $0$ | |
| $1$ | |
| $5$ |
(d) draw a continuous curve through the points.
(there are four graphs of $g(x)$ with coordinate axes, omitted here)
Part (a)
The Leading Coefficient Test depends on the degree (even or odd) and the leading coefficient (positive or negative) of the polynomial. For \( g(x) = x^4 - 16x^2 \), the degree is 4 (even) and the leading coefficient is 1 (positive). For polynomials with an even degree and a positive leading coefficient, the graph rises to the left and rises to the right. So the correct option is "The graph of the function rises to the left and rises to the right."
Part (b)
To find the real zeros, we set \( g(x) = 0 \):
\[
\]
Setting each factor equal to zero:
- \( x^2 = 0 \) gives \( x = 0 \) (with multiplicity 2)
- \( x - 4 = 0 \) gives \( x = 4 \)
- \( x + 4 = 0 \) gives \( x = -4 \)
So the real zeros are \( x = -4, 0, 4 \).
Part (c)
We calculate \( g(x) \) for the given \( x \)-values:
- For \( x = -5 \):
\[
\]
- For \( x = -1 \):
\[
\]
- For \( x = 0 \):
\[
g(0) = 0^4 - 16(0)^2 = 0
\]
- For \( x = 1 \):
\[
\]
- For \( x = 5 \):
\[
\]
So the table is:
| \( x \) | \( g(x) \) |
|---|---|
| -1 | -15 |
| 0 | 0 |
| 1 | -15 |
| 5 | 225 |
Part (d)
To draw the continuous curve, we use the information from the Leading Coefficient Test (rises on both ends), the real zeros (\( x = -4, 0, 4 \)), and the plotted points. The graph will touch the x - axis at \( x = 0 \) (since the multiplicity of the zero at \( x = 0 \) is 2, an even multiplicity, the graph touches the axis and turns around) and cross the x - axis at \( x=- 4 \) and \( x = 4 \) (odd multiplicity, multiplicity 1). The graph will have a "W" - like shape (but since it rises on both ends) with a minimum between \( - 4 \) and \( 0 \), a minimum between \( 0 \) and \( 4 \), and maxima outside the interval \( [-4,4] \). The correct graph is the one that rises to the left and right, has zeros at \( - 4,0,4 \), and passes through the points \( (-5,225),(-1, - 15),(0,0),(1, - 15),(5,225) \).
Final Answers
(a) The graph of the function rises to the left and rises to the right.
(b) \( x = \boldsymbol{-4, 0, 4} \)
(c) The table values are: \( x=-5, g(x)=225 \); \( x = - 1, g(x)=-15 \); \( x = 0, g(x)=0 \); \( x = 1, g(x)=-15 \); \( x = 5, g(x)=225 \)
(d) The graph that rises to the left and right, has zeros at \( x=-4,0,4 \), and passes through the calculated points (the second graph in the given options, the one with the "W" - shape and rising ends).

Snap & solve any problem in the app
Get step-by-step solutions on Sovi AI
Photo-based solutions with guided steps
Explore more problems and detailed explanations
Part (a)
The Leading Coefficient Test depends on the degree (even or odd) and the leading coefficient (positive or negative) of the polynomial. For \( g(x) = x^4 - 16x^2 \), the degree is 4 (even) and the leading coefficient is 1 (positive). For polynomials with an even degree and a positive leading coefficient, the graph rises to the left and rises to the right. So the correct option is "The graph of the function rises to the left and rises to the right."
Part (b)
To find the real zeros, we set \( g(x) = 0 \):
\[
\]
Setting each factor equal to zero:
- \( x^2 = 0 \) gives \( x = 0 \) (with multiplicity 2)
- \( x - 4 = 0 \) gives \( x = 4 \)
- \( x + 4 = 0 \) gives \( x = -4 \)
So the real zeros are \( x = -4, 0, 4 \).
Part (c)
We calculate \( g(x) \) for the given \( x \)-values:
- For \( x = -5 \):
\[
\]
- For \( x = -1 \):
\[
\]
- For \( x = 0 \):
\[
g(0) = 0^4 - 16(0)^2 = 0
\]
- For \( x = 1 \):
\[
\]
- For \( x = 5 \):
\[
\]
So the table is:
| \( x \) | \( g(x) \) |
|---|---|
| -1 | -15 |
| 0 | 0 |
| 1 | -15 |
| 5 | 225 |
Part (d)
To draw the continuous curve, we use the information from the Leading Coefficient Test (rises on both ends), the real zeros (\( x = -4, 0, 4 \)), and the plotted points. The graph will touch the x - axis at \( x = 0 \) (since the multiplicity of the zero at \( x = 0 \) is 2, an even multiplicity, the graph touches the axis and turns around) and cross the x - axis at \( x=- 4 \) and \( x = 4 \) (odd multiplicity, multiplicity 1). The graph will have a "W" - like shape (but since it rises on both ends) with a minimum between \( - 4 \) and \( 0 \), a minimum between \( 0 \) and \( 4 \), and maxima outside the interval \( [-4,4] \). The correct graph is the one that rises to the left and right, has zeros at \( - 4,0,4 \), and passes through the points \( (-5,225),(-1, - 15),(0,0),(1, - 15),(5,225) \).
Final Answers
(a) The graph of the function rises to the left and rises to the right.
(b) \( x = \boldsymbol{-4, 0, 4} \)
(c) The table values are: \( x=-5, g(x)=225 \); \( x = - 1, g(x)=-15 \); \( x = 0, g(x)=0 \); \( x = 1, g(x)=-15 \); \( x = 5, g(x)=225 \)
(d) The graph that rises to the left and right, has zeros at \( x=-4,0,4 \), and passes through the calculated points (the second graph in the given options, the one with the "W" - shape and rising ends).