QUESTION IMAGE
Question
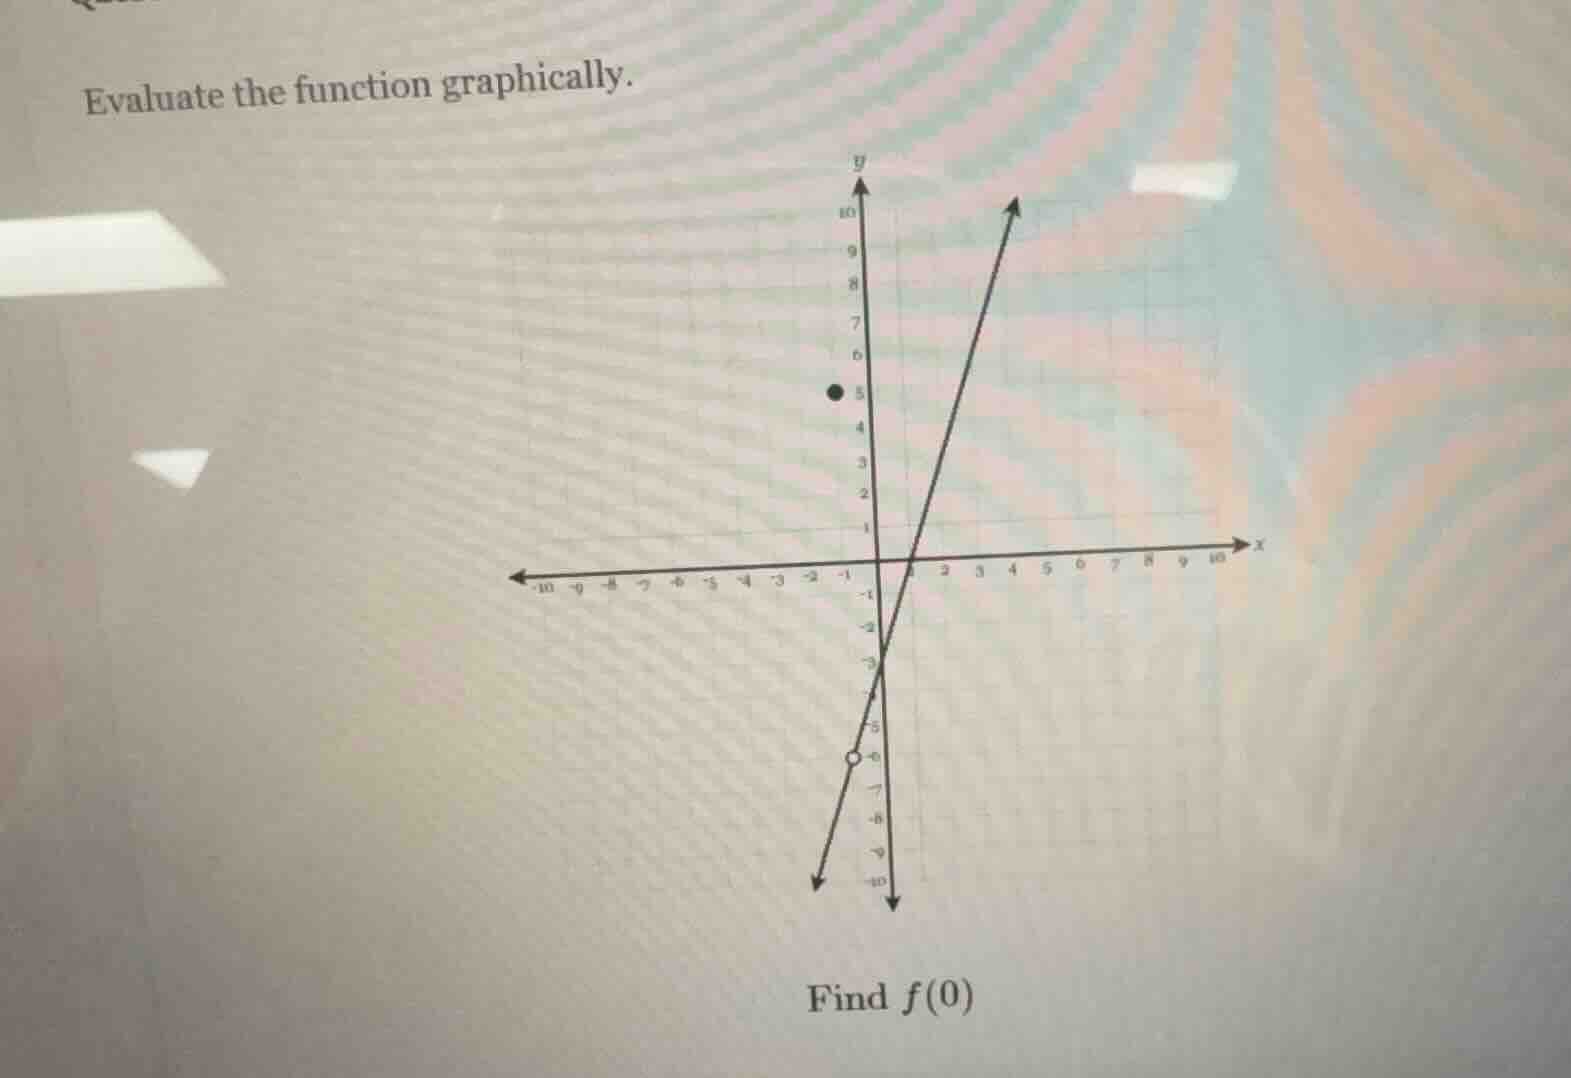
evaluate the function graphically. find $f(0)$
Step1: Understand the task
We need to find \( f(0) \) from the graph, which means finding the \( y \)-value when \( x = 0 \) (the \( y \)-intercept of the function's graph, considering the correct point at \( x = 0 \)).
Step2: Analyze the graph at \( x = 0 \)
Looking at the graph, when \( x = 0 \), we check the point on the function's graph. The graph has a line, and at \( x = 0 \), the \( y \)-coordinate of the point on the line (the solid or relevant part for the function's value at \( x = 0 \)) is -3? Wait, no, wait. Wait, the graph: let's see, the line passes through \( x = 0 \). Wait, the \( y \)-axis is \( x = 0 \). Looking at the graph, the line (the main line) at \( x = 0 \) has a \( y \)-value? Wait, no, maybe I misread. Wait, the graph: there's a line, and at \( x = 0 \), the point on the line (the functional value) – wait, the graph shows that at \( x = 0 \), the line crosses the \( y \)-axis at \( y=-3 \)? Wait, no, let's check again. Wait, the problem is to find \( f(0) \), so we look for the \( y \)-coordinate when \( x = 0 \). The graph: the line (the one with the arrow going up) – wait, no, there are two lines? Wait, no, the graph has a line that passes through the origin? Wait, no, the \( y \)-axis is \( x = 0 \). Let's see the coordinates: when \( x = 0 \), the point on the function (the line) – wait, the graph shows that at \( x = 0 \), the \( y \)-value is -3? Wait, no, maybe I made a mistake. Wait, the graph: the line (the one with the arrow) – let's see, when \( x = 0 \), the \( y \)-coordinate of the point on the line is -3? Wait, no, looking at the graph, the line (the main line) at \( x = 0 \) (the \( y \)-axis) has a \( y \)-value of -3? Wait, no, maybe the correct point: when \( x = 0 \), the function's value is the \( y \)-coordinate at \( x = 0 \). Looking at the graph, the line (the one that's a straight line) at \( x = 0 \) is at \( y = -3 \)? Wait, no, maybe I misread. Wait, the graph: the \( y \)-axis is \( x = 0 \). The line (the one with the arrow going up) – when \( x = 0 \), what's the \( y \)-value? Wait, the graph has a point at \( x = -1 \), \( y = 5 \) (a black dot), and a hollow circle at \( x = -1 \), \( y = -6 \). But for \( x = 0 \), we look at the line (the main line) – the one that passes through the origin? Wait, no, the line (the one with the arrow) – let's see, when \( x = 0 \), the \( y \)-coordinate is -3? Wait, no, maybe the correct answer is -3? Wait, no, let's check again. Wait, the problem is to find \( f(0) \), so we find the \( y \)-value when \( x = 0 \). The graph: the line (the function's graph) at \( x = 0 \) (the \( y \)-axis) – looking at the graph, the line (the one with the arrow going up) – when \( x = 0 \), the \( y \)-value is -3? Wait, no, maybe I made a mistake. Wait, the graph: the \( y \)-axis is \( x = 0 \). The line (the main line) – let's see, the line passes through \( x = 1 \), \( y = 0 \)? No, wait, the origin is (0,0), but the line crosses the \( y \)-axis at (0, -3)? Wait, maybe. So when \( x = 0 \), \( f(0) = -3 \)? Wait, no, maybe I misread. Wait, the graph: the line (the one with the arrow) – at \( x = 0 \), the \( y \)-coordinate is -3. So \( f(0) = -3 \).
Wait, maybe I should re-express: to find \( f(0) \), we locate \( x = 0 \) on the \( x \)-axis (the \( y \)-axis), then find the corresponding \( y \)-value on the function's graph. The graph shows that at \( x = 0 \), the point on the function (the line) has a \( y \)-value of -3. So \( f(0) = -3 \).

Snap & solve any problem in the app
Get step-by-step solutions on Sovi AI
Photo-based solutions with guided steps
Explore more problems and detailed explanations
\( \boldsymbol{-3} \)