QUESTION IMAGE
Question
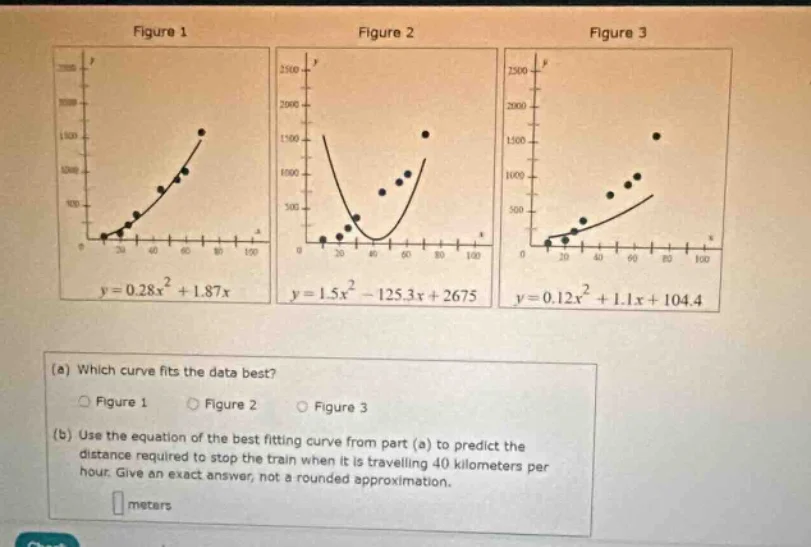
figure 1
figure 2
figure 3
$y = 0.28x^{2}+1.87x$
$y = 1.5x^{2}-125.3x + 2675$
$y = 0.12x^{2}+1.1x + 104.4$
(a) which curve fits the data best?
$circ$ figure 1 $circ$ figure 2 $circ$ figure 3
(b) use the equation of the best fitting curve from part (a) to predict the
distance required to stop the train when it is travelling 40 kilometers per
hour. give an exact answer, not a rounded approximation.
$square$ meters
Step1: Evaluate curve fit accuracy
Visually compare data points to each curve: Figure 1's points lie closest to its regression line, with minimal deviation, so it is the best fit.
Step2: Substitute x=40 into Figure1's equation
Use $y=0.28x^2 + 1.87x$, replace $x$ with 40.
First calculate $0.28(40)^2$:
$0.28\times1600 = 448$
Then calculate $1.87\times40 = 74.8$
Step3: Sum the two results
Add the two values to find $y$.
$448 + 74.8 = 522.8$

Snap & solve any problem in the app
Get step-by-step solutions on Sovi AI
Photo-based solutions with guided steps
Explore more problems and detailed explanations
(a) Figure 1
(b) 522.8 meters