QUESTION IMAGE
Question
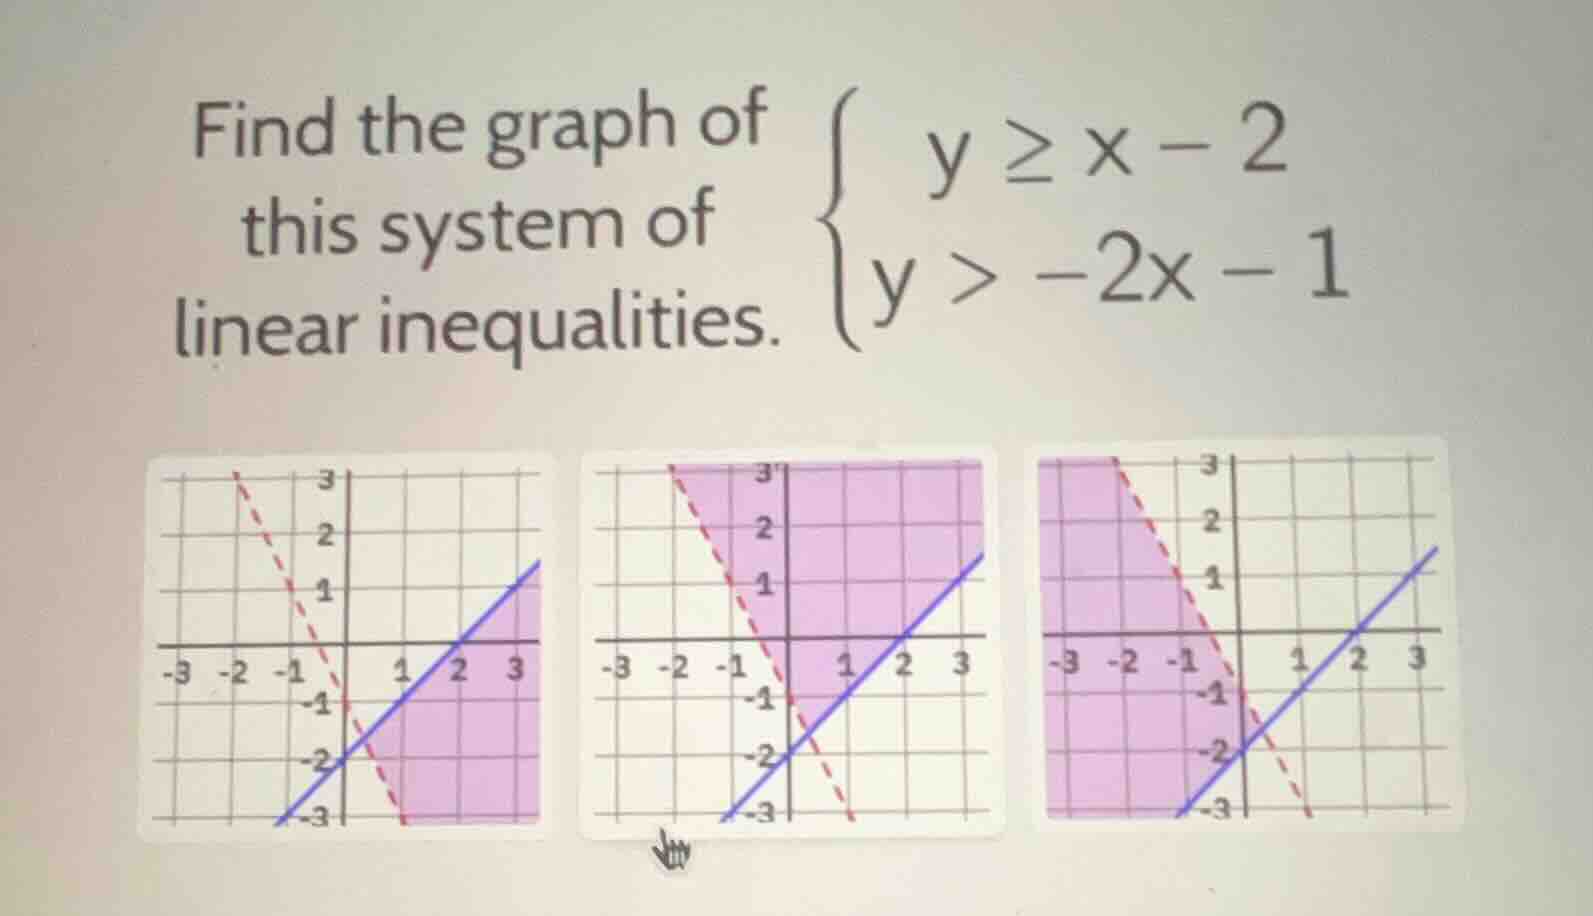
find the graph of this system of linear inequalities. \\(\
\\)
Step1: Analyze \( y \geq x - 2 \)
The line \( y = x - 2 \) has a slope of \( 1 \) and a y - intercept of \( - 2 \). Since the inequality is \( y\geq x - 2 \), we draw a solid line (because the inequality includes equality) for \( y=x - 2 \) and shade the region above the line (because \( y \) is greater than or equal to \( x - 2 \)).
Step2: Analyze \( y > - 2x - 1 \)
The line \( y=-2x - 1 \) has a slope of \( - 2 \) and a y - intercept of \( - 1 \). Since the inequality is \( y > - 2x - 1 \), we draw a dashed line (because the inequality does not include equality) for \( y = - 2x-1 \) and shade the region above the line (because \( y \) is greater than \( - 2x - 1 \)).
Step3: Find the intersection of the two shaded regions
The solution to the system of inequalities is the region that is shaded for both \( y\geq x - 2 \) and \( y > - 2x - 1 \).
- For the line \( y=x - 2 \) (solid line), when \( x = 0 \), \( y=-2 \); when \( y = 0 \), \( x = 2 \).
- For the line \( y=-2x - 1 \) (dashed line), when \( x = 0 \), \( y=-1 \); when \( y = 0 \), \( x=-\frac{1}{2}\).
By looking at the three graphs:
- The first graph: The shaded region for \( y\geq x - 2 \) (above the solid line) and \( y > - 2x - 1 \) (above the dashed line) does not match as the intersection is not correct.
- The second graph: The region above the solid line \( y = x - 2 \) and above the dashed line \( y=-2x - 1 \) is the overlapping region. The solid line is \( y=x - 2 \) (passes through \( (0,-2) \) and \( (2,0) \)) and the dashed line is \( y=-2x - 1 \) (passes through \( (0, - 1) \) and \( (-\frac{1}{2},0) \)). The shaded region in the second graph is the area that is above both lines, which is the correct intersection.
- The third graph: The shaded region is not the intersection of the two required regions.

Snap & solve any problem in the app
Get step-by-step solutions on Sovi AI
Photo-based solutions with guided steps
Explore more problems and detailed explanations
The second graph (the middle one) is the graph of the system of linear inequalities.