QUESTION IMAGE
Question
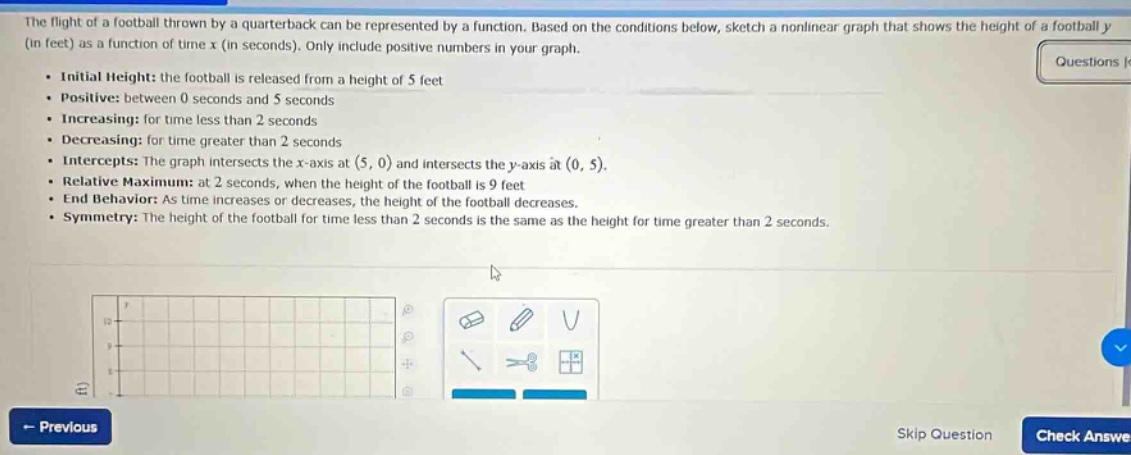
the flight of a football thrown by a quarterback can be represented by a function. based on the conditions below, sketch a nonlinear graph that shows the height of a football y (in feet) as a function of time x (in seconds). only include positive numbers in your graph. - initial height: the football is released from a height of 5 feet - positive: between 0 seconds and 5 seconds - increasing: for time less than 2 seconds - decreasing: for time greater than 2 seconds - intercepts: the graph intersects the x - axis at (5, 0) and intersects the y - axis at (0, 5). - relative maximum: at 2 seconds, when the height of the football is 9 feet - end behavior: as time increases or decreases, the height of the football decreases. - symmetry: the height of the football for time less than 2 seconds is the same as the height for time greater than 2 seconds.
Step1: Identify Key Points
We have the following key points from the problem:
- y - intercept: \((0, 5)\) (initial height)
- x - intercept: \((5, 0)\) (when the football hits the ground)
- Relative maximum: \((2, 9)\) (highest point of the football's flight)
- The graph is symmetric about \(x = 2\) (since the height for time less than 2 seconds is the same as for time greater than 2 seconds)
- The graph is increasing for \(x<2\) and decreasing for \(x > 2\)
- The graph is positive ( \(y>0\)) for \(0
Step2: Plot the Key Points
First, plot the points \((0, 5)\), \((2, 9)\) and \((5, 0)\) on the coordinate plane.
Step3: Draw the Curve
Since the graph is symmetric about \(x = 2\), the shape of the graph from \(x = 0\) to \(x=2\) (increasing) should be a mirror image of the shape from \(x = 2\) to \(x = 5\) (decreasing). The graph should be a smooth curve (non - linear) passing through these points, increasing from \((0, 5)\) to \((2, 9)\) and then decreasing from \((2, 9)\) to \((5, 0)\). Also, since the end - behavior is that as \(x\) increases or decreases, \(y\) decreases, but we only consider positive \(x\) (time) values, so we focus on the interval \(x\in[0,5]\).

Snap & solve any problem in the app
Get step-by-step solutions on Sovi AI
Photo-based solutions with guided steps
Explore more problems and detailed explanations
To sketch the graph:
- Plot the points \((0, 5)\), \((2, 9)\) and \((5, 0)\) on the coordinate plane where the \(x\) - axis represents time (in seconds) and the \(y\) - axis represents height (in feet).
- Draw a smooth, nonlinear curve (a parabola - like shape due to symmetry and the increasing/decreasing behavior) that passes through these points. The curve should be increasing from \((0, 5)\) to \((2, 9)\) and decreasing from \((2, 9)\) to \((5, 0)\), and be symmetric about the vertical line \(x = 2\).