QUESTION IMAGE
Question
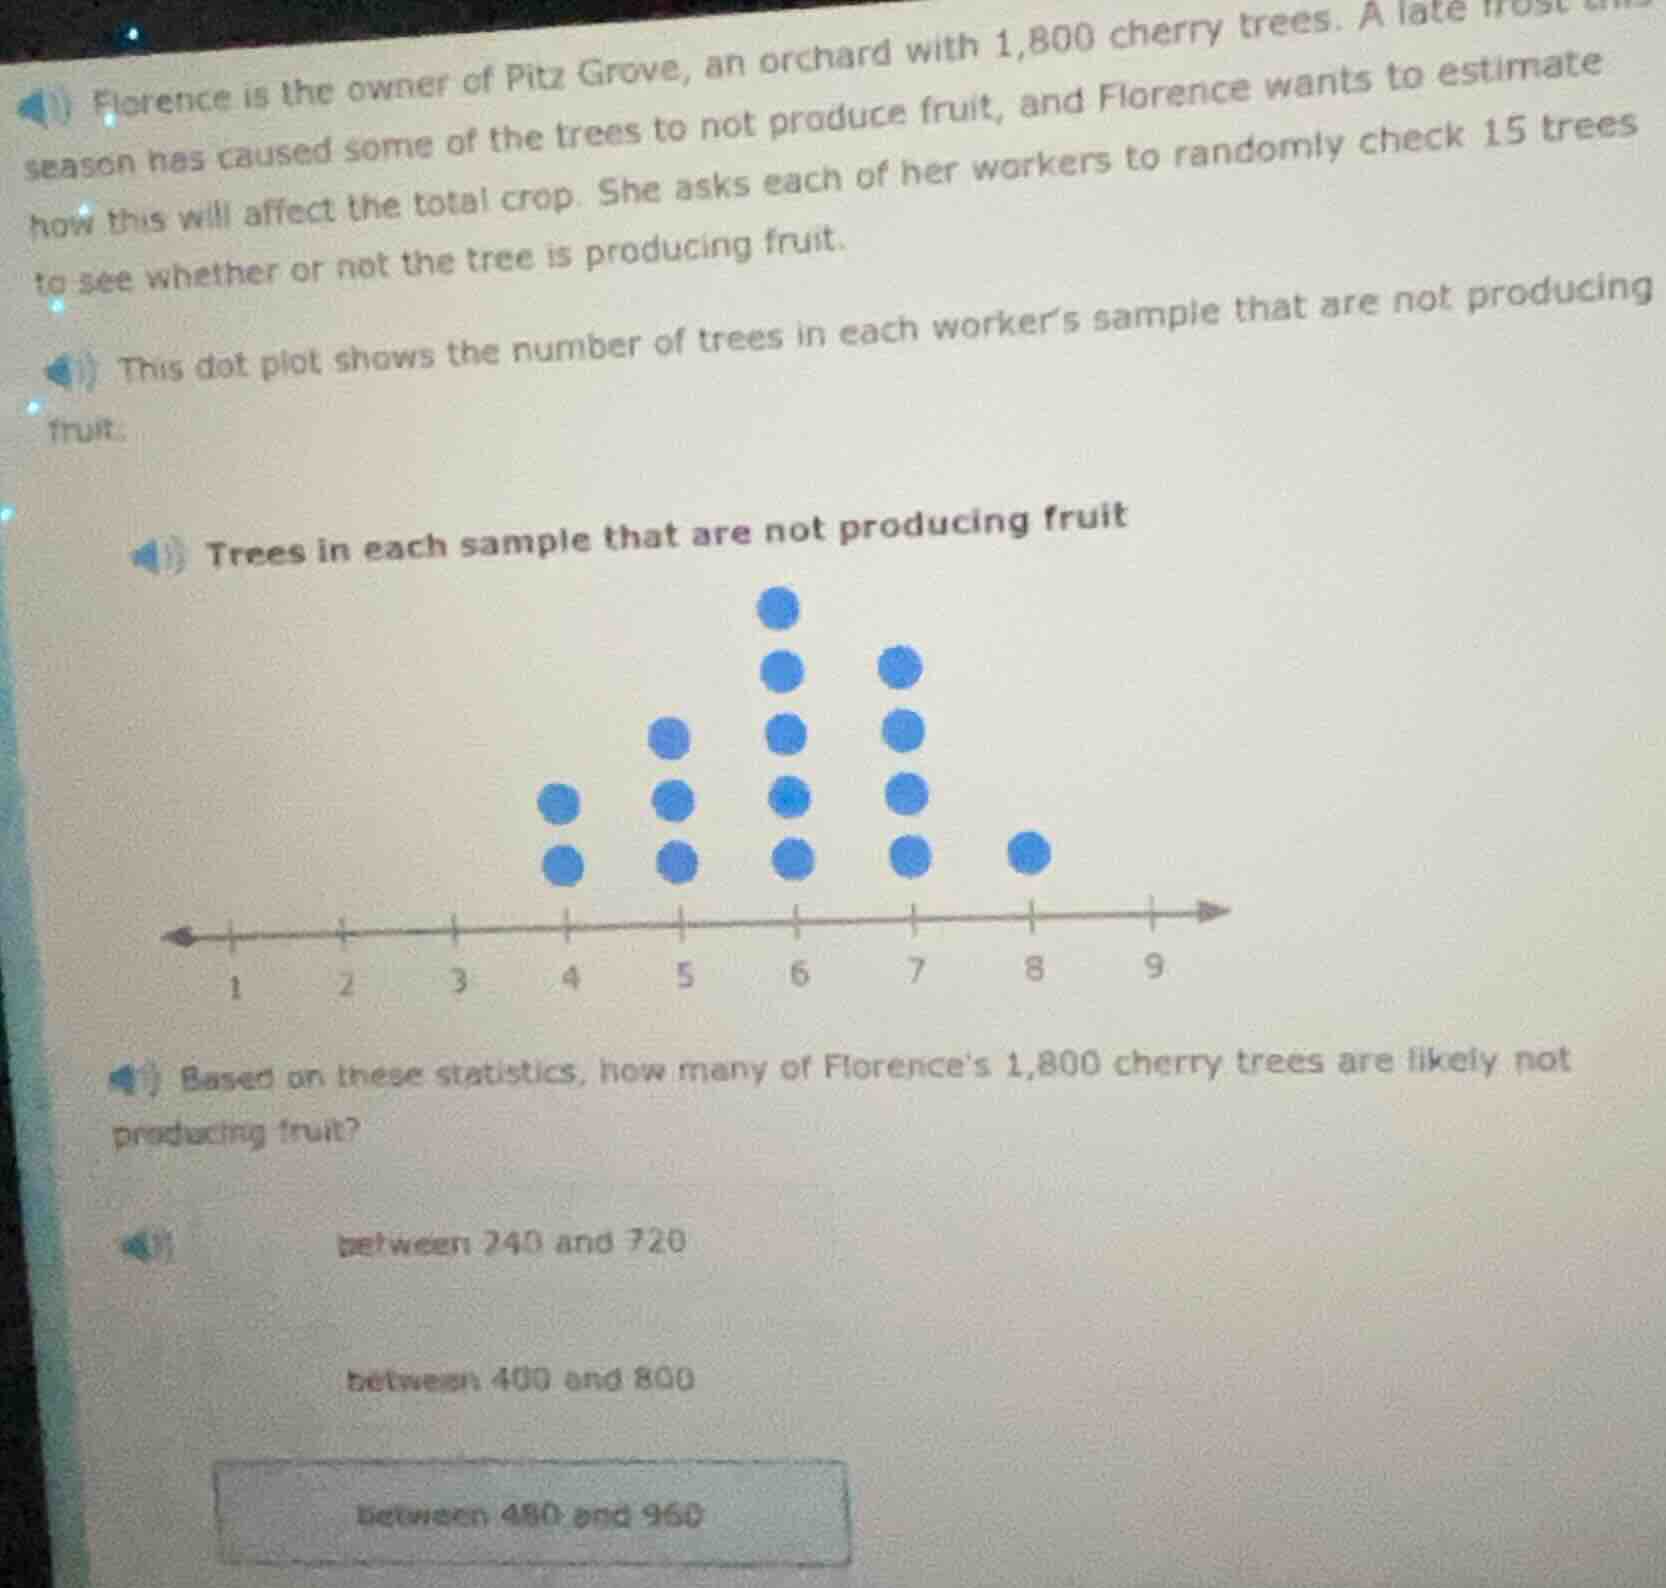
florence is the owner of pitz grove, an orchard with 1,800 cherry trees. a late frost this season has caused some of the trees to not produce fruit, and florence wants to estimate how this will affect the total crop. she asks each of her workers to randomly check 15 trees to see whether or not the tree is producing fruit. this dot plot shows the number of trees in each worker’s sample that are not producing fruit. trees in each sample that are not producing fruit dot plot with number line from 1 to 9, dots at 4:2, 5:3, 6:5, 7:4, 8:1 based on these statistics, how many of florence’s 1,800 cherry trees are likely not producing fruit? between 240 and 720 between 400 and 800 between 480 and 960
Step1: Calculate total number of samples
First, we count the number of dots in the dot - plot. For \(x = 4\), there are 2 dots; for \(x=5\), there are 3 dots; for \(x = 6\), there are 4 dots; for \(x=7\), there are 4 dots; for \(x = 8\), there is 1 dot. The total number of samples (workers) \(n=2 + 3+4 + 4+1=14\)? Wait, no, let's re - count. Wait, \(x = 4\): 2 dots, \(x = 5\): 3 dots, \(x=6\): 4 dots, \(x = 7\): 4 dots, \(x=8\): 1 dot. Wait, \(2 + 3+4 + 4+1=14\)? Wait, maybe I made a mistake. Wait, the dot - plot: at 4: 2 dots, at 5: 3 dots, at 6: 4 dots, at 7: 4 dots, at 8: 1 dot. Wait, but maybe the correct way is to find the average number of non - producing trees per sample.
The formula for the average \(\bar{x}=\frac{\sum_{i}x_{i}\times f_{i}}{\sum_{i}f_{i}}\), where \(x_{i}\) is the number of non - producing trees and \(f_{i}\) is the frequency (number of samples with \(x_{i}\) non - producing trees).
For \(x = 4\), \(f = 2\); \(x = 5\), \(f=3\); \(x = 6\), \(f = 4\); \(x=7\), \(f = 4\); \(x = 8\), \(f=1\).
\(\sum_{i}x_{i}\times f_{i}=4\times2 + 5\times3+6\times4 + 7\times4+8\times1=8 + 15+24 + 28+8=83\)
\(\sum_{i}f_{i}=2 + 3+4 + 4+1 = 14\)
The average number of non - producing trees per sample of 15 trees is \(\bar{x}=\frac{83}{14}\approx5.93\) (approximately 6)
Step2: Estimate the proportion of non - producing trees
The proportion of non - producing trees in a sample of 15 trees is \(p=\frac{\bar{x}}{15}\approx\frac{6}{15}=\frac{2}{5}\)
Step3: Estimate the total number of non - producing trees
The total number of cherry trees is \(N = 1800\). The estimated number of non - producing trees is \(N\times p=1800\times\frac{\bar{x}}{15}\)
Since \(\bar{x}\) is between, let's find the minimum and maximum possible average.
Minimum average: If we take the minimum \(x\) values. The minimum \(x\) is 4, maximum \(x\) is 8.
If we consider the range of the number of non - producing trees per sample:
The minimum number of non - producing trees per sample: the smallest \(x\) is 4, the largest is 8.
The proportion of non - producing trees per sample ranges from \(\frac{4}{15}\) to \(\frac{8}{15}\)
Total number of non - producing trees ranges from \(1800\times\frac{4}{15}\) to \(1800\times\frac{8}{15}\)
Calculate \(1800\times\frac{4}{15}=\frac{1800\times4}{15}=480\)
Calculate \(1800\times\frac{8}{15}=\frac{1800\times8}{15}=960\)

Snap & solve any problem in the app
Get step-by-step solutions on Sovi AI
Photo-based solutions with guided steps
Explore more problems and detailed explanations
between 480 and 960