QUESTION IMAGE
Question
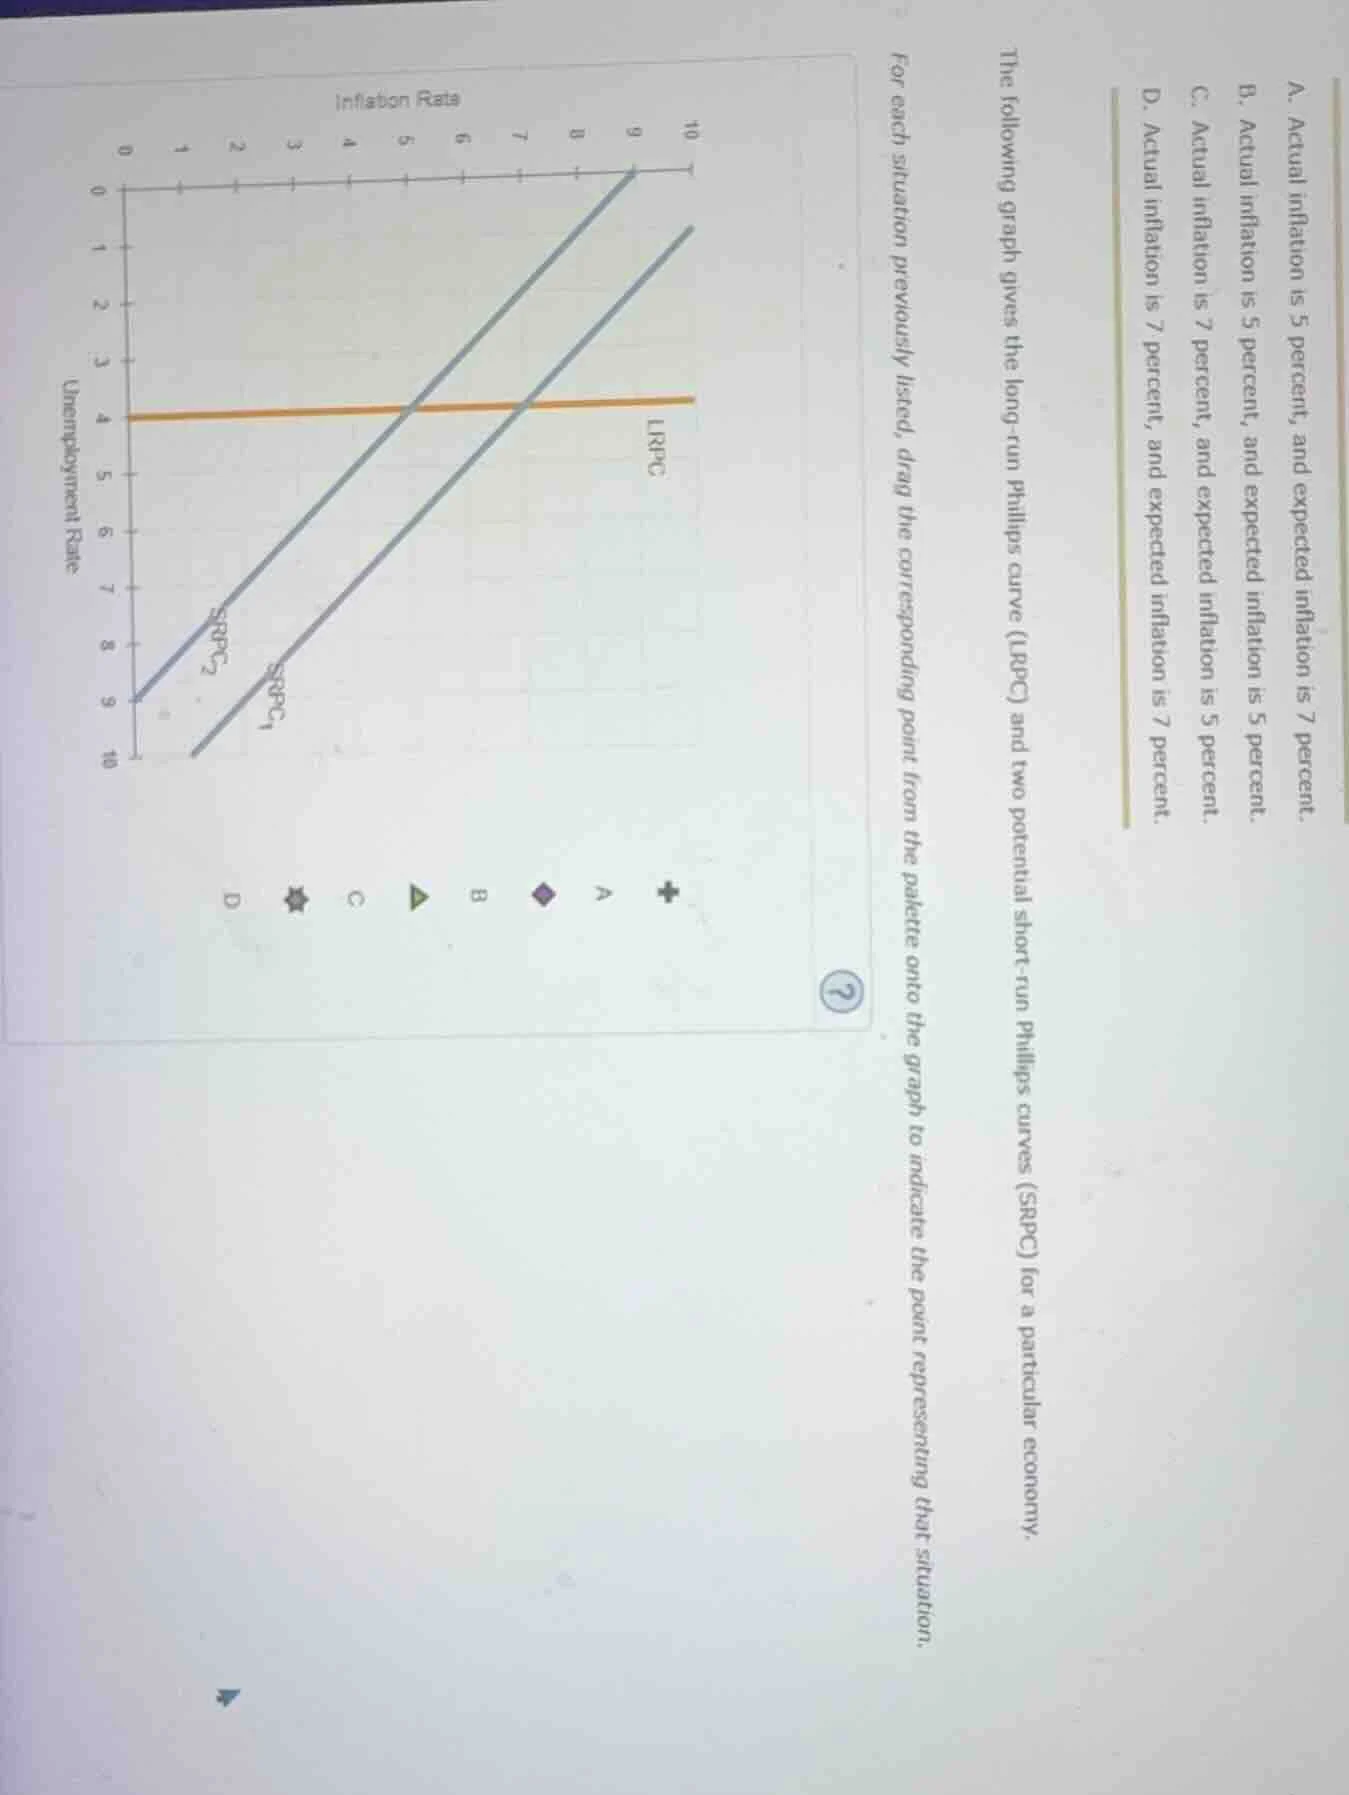
the following graph gives the long - run phillips curve (lrpc) and two potential short - run phillips curves (srpc) for a particular economy. for each situation previously listed, drag the corresponding point from the palette onto the graph to indicate the point representing that situation.
a. actual inflation is 5 percent, and expected inflation is 7 percent.
b. actual inflation is 5 percent, and expected inflation is 5 percent.
c. actual inflation is 7 percent, and expected inflation is 5 percent.
d. actual inflation is 7 percent, and expected inflation is 7 percent.
- For a point on the Long-Run Phillips Curve (LRPC), actual inflation equals expected inflation, and unemployment is at the natural rate (4% here).
- For points on a Short-Run Phillips Curve (SRPC), expected inflation equals the inflation rate at the natural unemployment rate (SRPC₁ aligns with 5% inflation at 4% unemployment; SRPC₂ aligns with 7% inflation at 4% unemployment).
- When actual inflation differs from expected inflation, unemployment moves away from the natural rate: lower actual inflation than expected means higher unemployment, and higher actual inflation than expected means lower unemployment.

Snap & solve any problem in the app
Get step-by-step solutions on Sovi AI
Photo-based solutions with guided steps
Explore more problems and detailed explanations
A. Actual inflation is 5 percent, and expected inflation is 7 percent. → Point D (Unemployment Rate = 9%, Inflation Rate = 5%)
B. Actual inflation is 5 percent, and expected inflation is 5 percent. → Point B (Unemployment Rate = 4%, Inflation Rate = 5%)
C. Actual inflation is 7 percent, and expected inflation is 5 percent. → Point A (Unemployment Rate = 1%, Inflation Rate = 7%)
D. Actual inflation is 7 percent, and expected inflation is 7 percent. → Point C (Unemployment Rate = 4%, Inflation Rate = 7%)