QUESTION IMAGE
Question
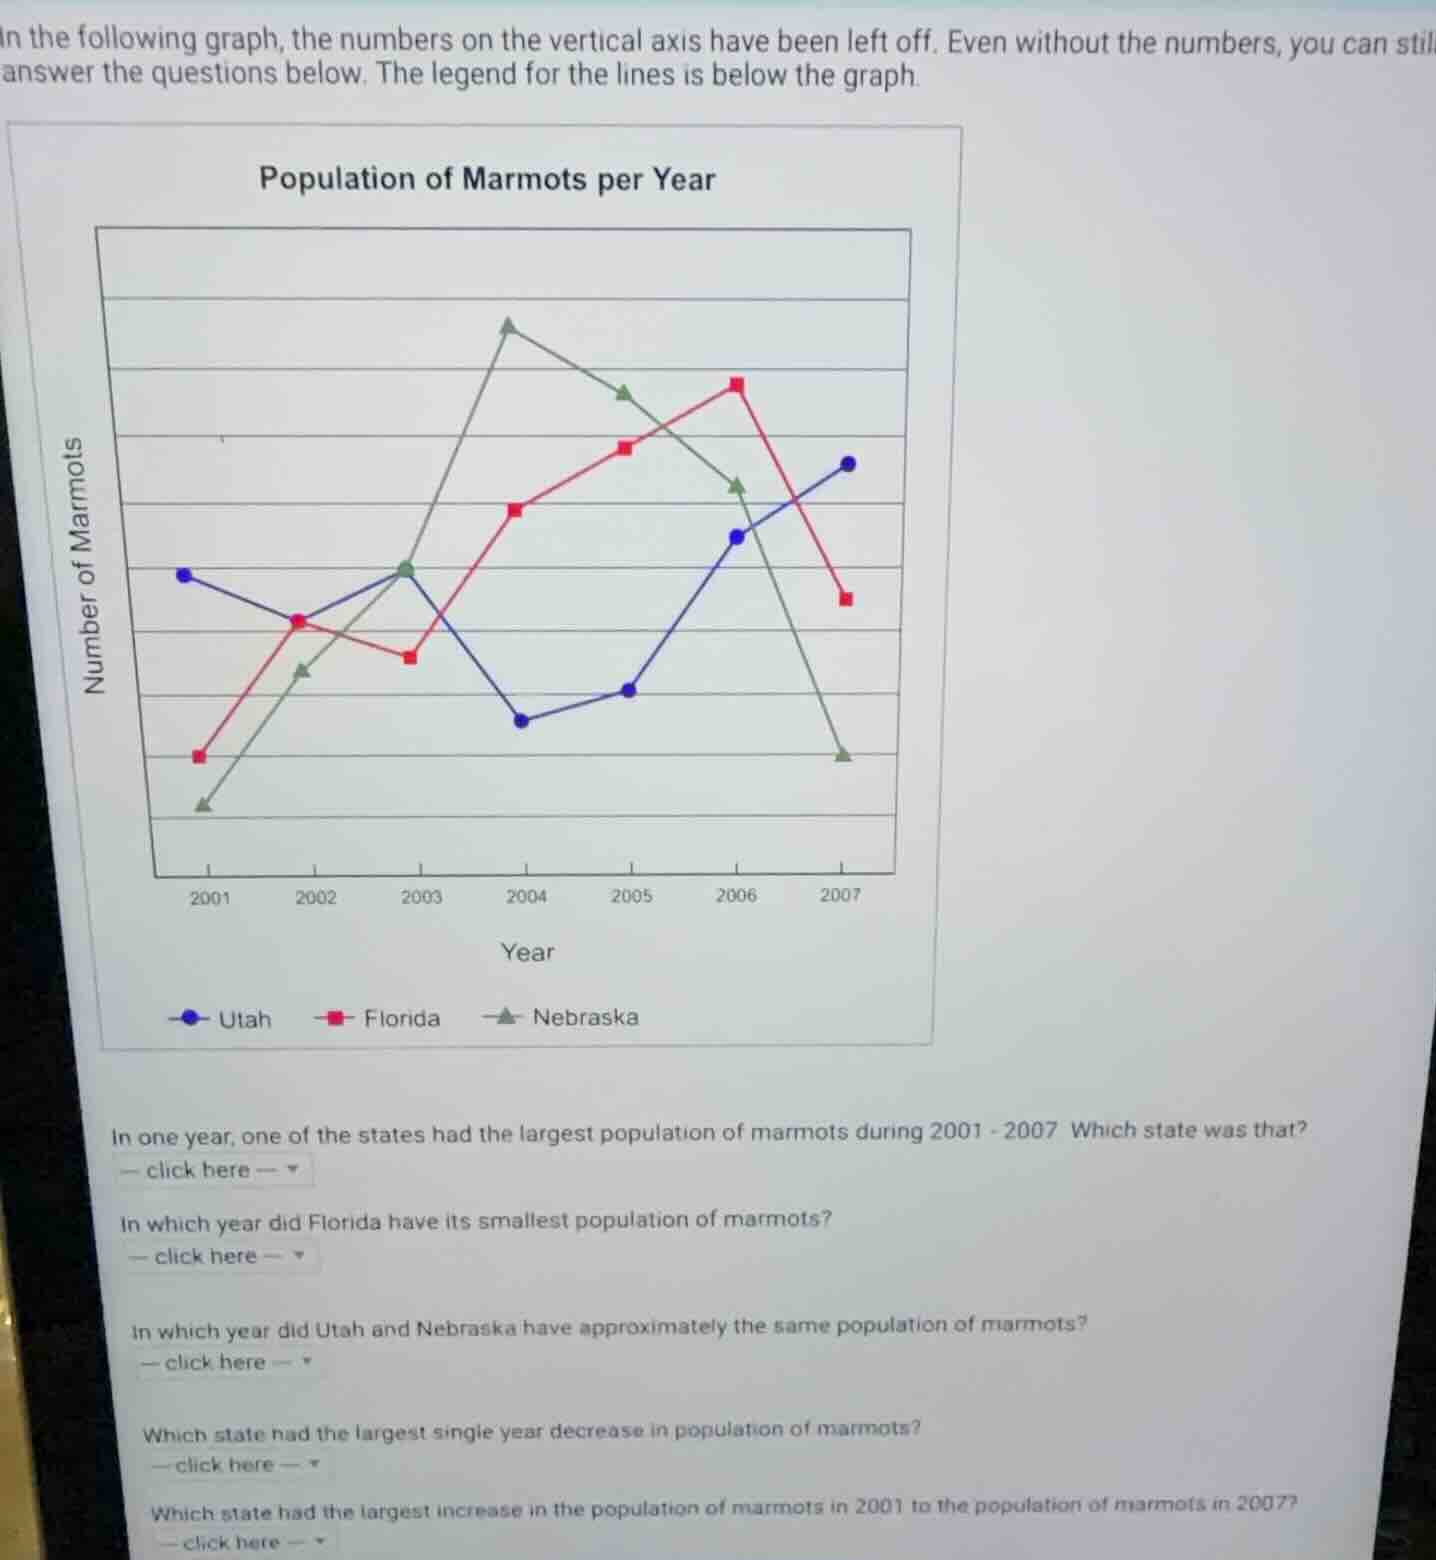
in the following graph, the numbers on the vertical axis have been left off. even without the numbers, you can still answer the questions below. the legend for the lines is below the graph.
population of marmots per year
graph of marmot population over years for utah, florida, nebraska
in one year, one of the states had the largest population of marmots during 2001 - 2007. which state was that?
— click here —
in which year did florida have its smallest population of marmots?
— click here —
in which year did utah and nebraska have approximately the same population of marmots?
— click here —
which state had the largest single year decrease in population of marmots?
— click here —
which state had the largest increase in the population of marmots in 2001 to the population of marmots in 2007?
— click here —
- For the largest single-year population, Nebraska's peak in 2004 is the highest point on the graph.
- Florida's lowest data point is in 2001, its smallest population.
- Utah and Nebraska's lines intersect in 2003, meaning their populations were nearly equal that year.
- Nebraska's population drops the most between 2006 and 2007, the largest single-year decrease.
- Comparing 2001 to 2007, Utah's population shows the biggest upward change, while Florida and Nebraska decline.

Snap & solve any problem in the app
Get step-by-step solutions on Sovi AI
Photo-based solutions with guided steps
Explore more problems and detailed explanations
- Nebraska
- 2001
- 2003
- Nebraska
- Utah