QUESTION IMAGE
Question
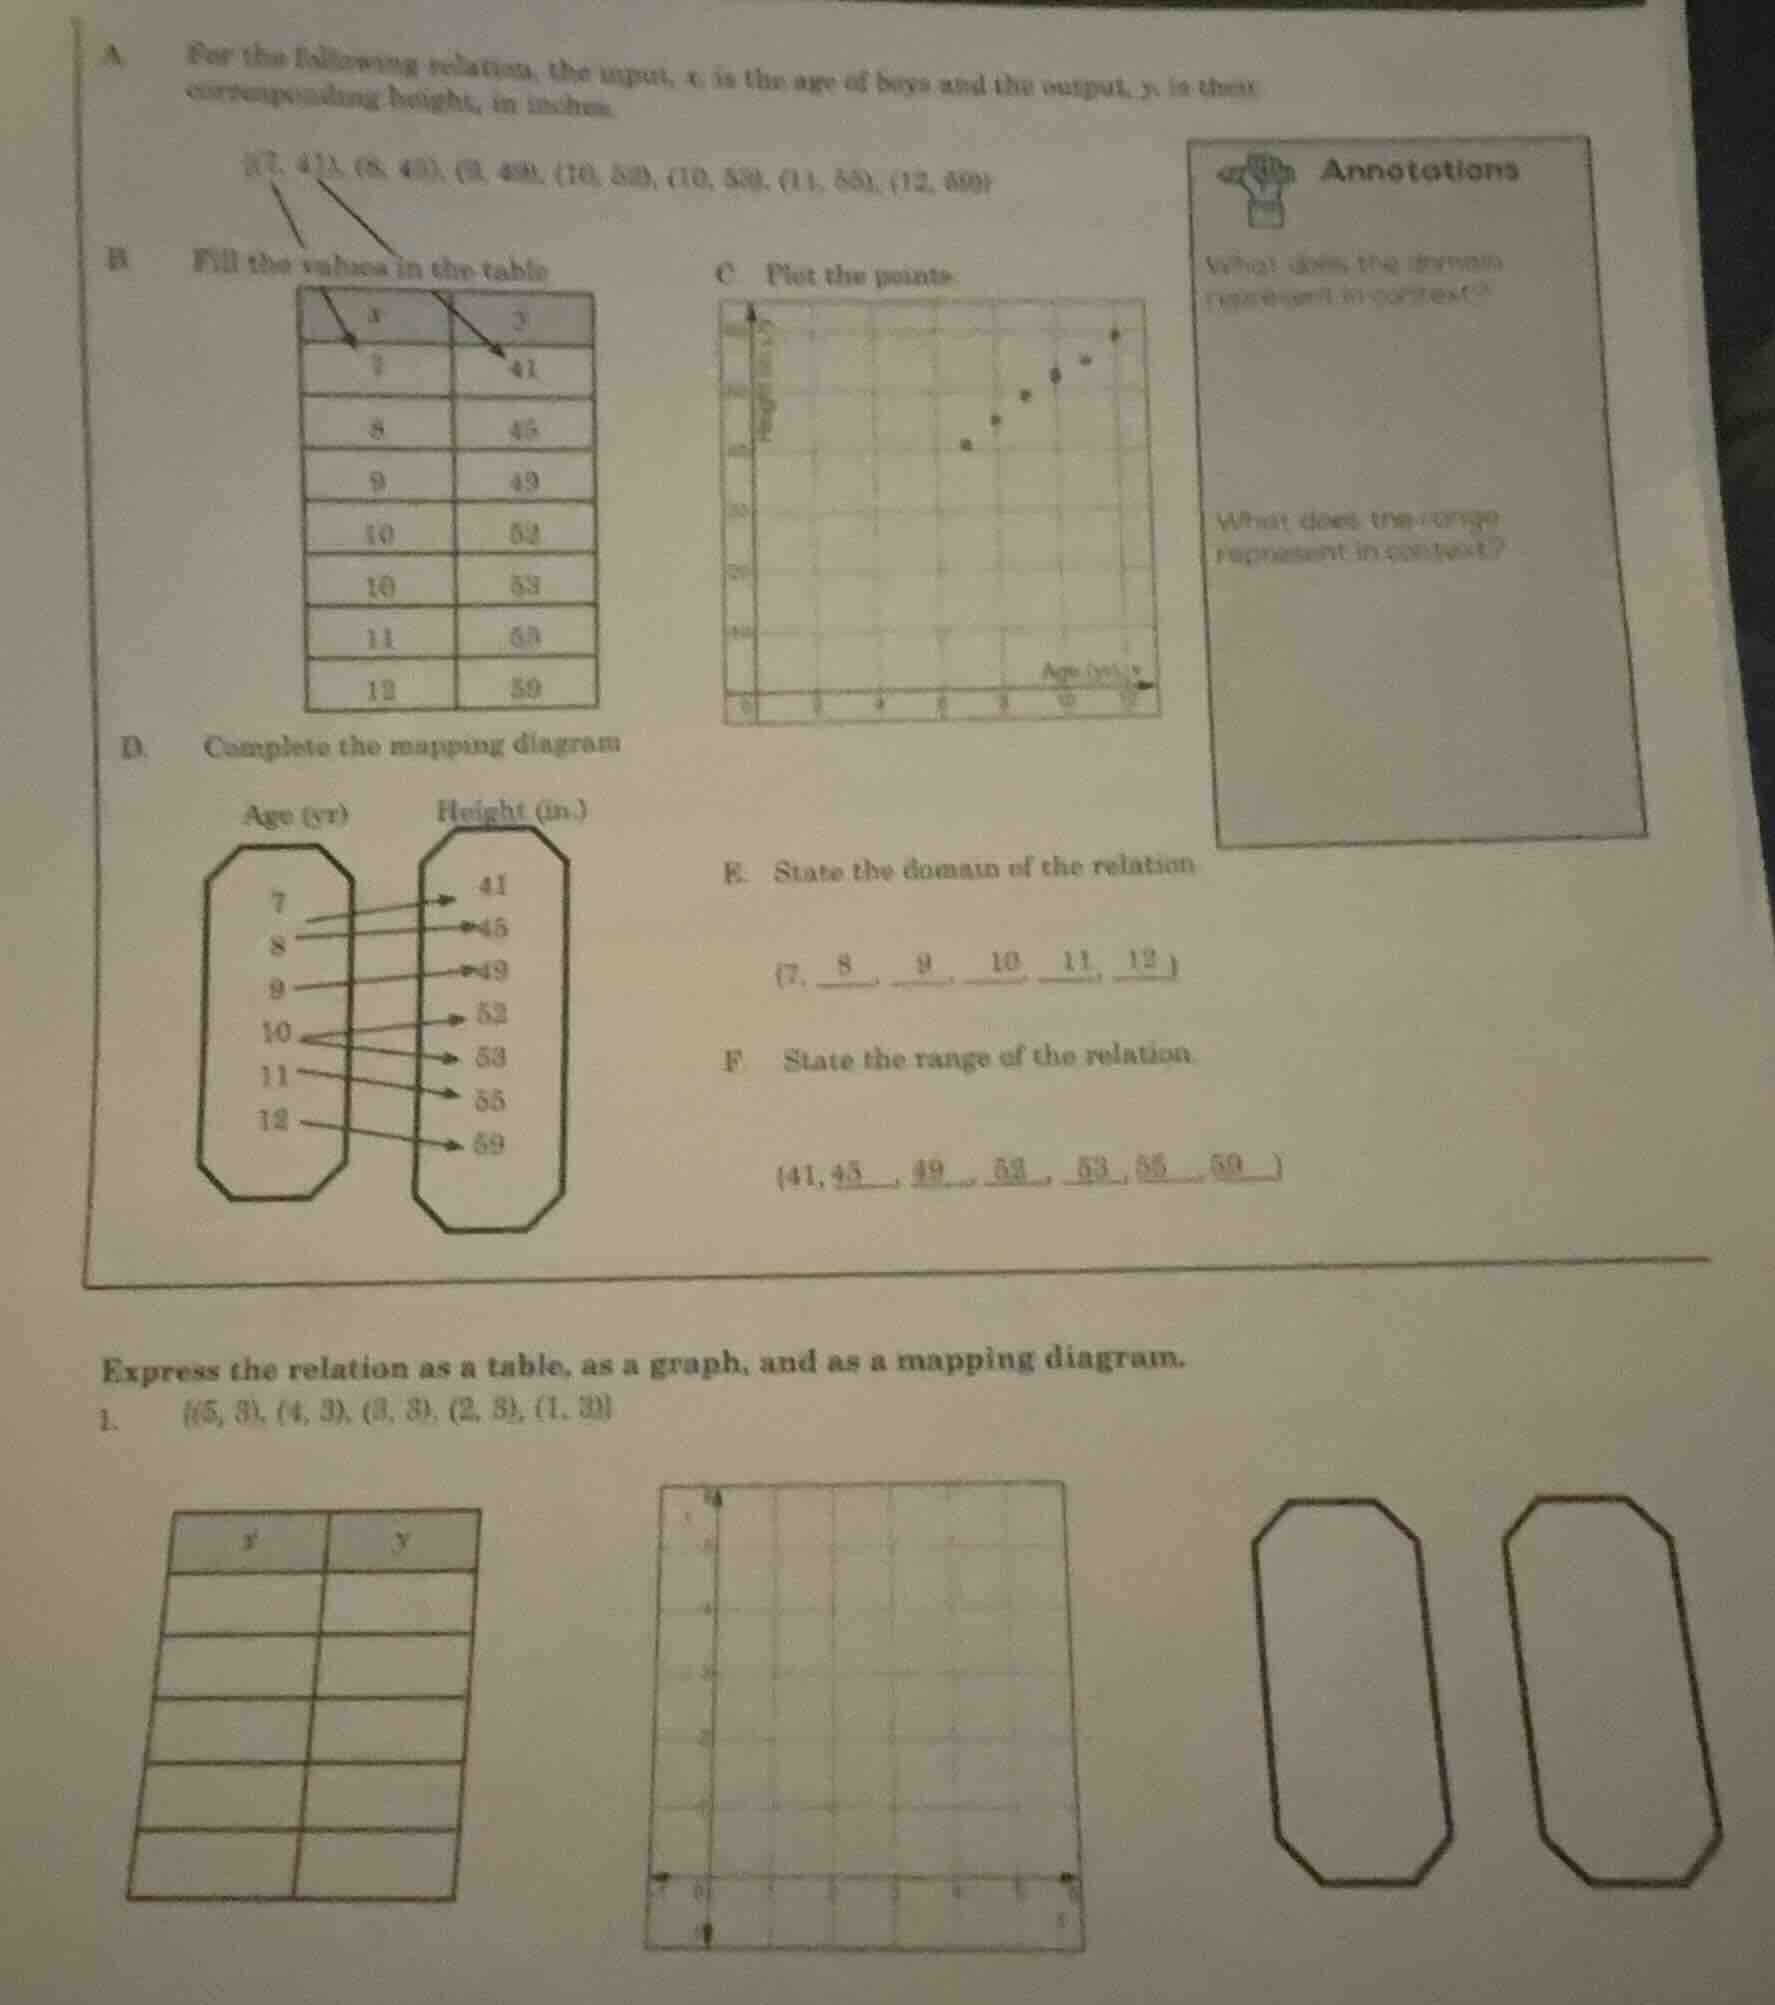
a. for the following relation, the input, x is the age of boys and the output, y, is their corresponding heights, in inches. (7, 41), (8, 45), (9, 49), (10, 52), (10, 53), (11, 55), (12, 59)
b. fill the values in the table
| x | y |
|---|---|
| 8 | 45 |
| 9 | 49 |
| 10 | 52 |
| 10 | 53 |
| 11 | 55 |
| 12 | 59 |
c. plot the points. graph with age (yr) on x - axis and height (in.) on y - axis
d. complete the mapping diagram
age (yr) : 7, 8, 9, 10, 11, 12
height (in.) : 41, 45, 49, 52, 53, 55, 59
e. state the domain of the relation
{7, , , , , __}
f. state the range of the relation
{41, , , , , , }
express the relation as a table, as a graph, and as a mapping diagram.
- {(5, 3), (4, 3), (3, 3), (2, 3), (1, 3)}
table, graph, and mapping diagram templates for the relation {(5, 3), (4, 3), (3, 3), (2, 3), (1, 3)}
Part 1: Table Representation
Step1: Identify x and y values
The relation is \(\{(5, 3), (4, 3), (3, 3), (2, 3), (1, 3)\}\). So \(x\)-values are 5, 4, 3, 2, 1 and \(y\)-value is 3 for all.
Step2: Fill the table
| \(x\) | \(y\) |
|---|---|
| 4 | 3 |
| 3 | 3 |
| 2 | 3 |
| 1 | 3 |
Part 2: Graph Representation
Step1: Identify coordinates
The points are \((5, 3)\), \((4, 3)\), \((3, 3)\), \((2, 3)\), \((1, 3)\).
Step2: Plot points
On a coordinate plane, plot each point. The \(x\)-axis will have values 1 - 5 and \(y\)-axis value 3. All points lie on the horizontal line \(y = 3\) at \(x = 1, 2, 3, 4, 5\).
Part 3: Mapping Diagram
Step1: Identify domains and range
Domain (input) values: 1, 2, 3, 4, 5. Range (output) value: 3.
Step2: Draw mapping
Draw two ovals. Left oval (domain) has 1, 2, 3, 4, 5. Right oval (range) has 3. Draw arrows from each domain value to 3.
Final Output for Table:
| \(x\) | \(y\) |
|---|---|
| 4 | 3 |
| 3 | 3 |
| 2 | 3 |
| 1 | 3 |
Final Output for Graph:
Plot the points \((1, 3)\), \((2, 3)\), \((3, 3)\), \((4, 3)\), \((5, 3)\) on a coordinate plane (all on the horizontal line \(y = 3\)).
Final Output for Mapping Diagram:
- Domain (left oval): 1, 2, 3, 4, 5
- Range (right oval): 3
- Arrows: From 1, 2, 3, 4, 5 to 3.

Snap & solve any problem in the app
Get step-by-step solutions on Sovi AI
Photo-based solutions with guided steps
Explore more problems and detailed explanations
Step1: Identify domains and range
Domain (input) values: 1, 2, 3, 4, 5. Range (output) value: 3.
Step2: Draw mapping
Draw two ovals. Left oval (domain) has 1, 2, 3, 4, 5. Right oval (range) has 3. Draw arrows from each domain value to 3.
Final Output for Table:
| \(x\) | \(y\) |
|---|---|
| 4 | 3 |
| 3 | 3 |
| 2 | 3 |
| 1 | 3 |
Final Output for Graph:
Plot the points \((1, 3)\), \((2, 3)\), \((3, 3)\), \((4, 3)\), \((5, 3)\) on a coordinate plane (all on the horizontal line \(y = 3\)).
Final Output for Mapping Diagram:
- Domain (left oval): 1, 2, 3, 4, 5
- Range (right oval): 3
- Arrows: From 1, 2, 3, 4, 5 to 3.