QUESTION IMAGE
Question
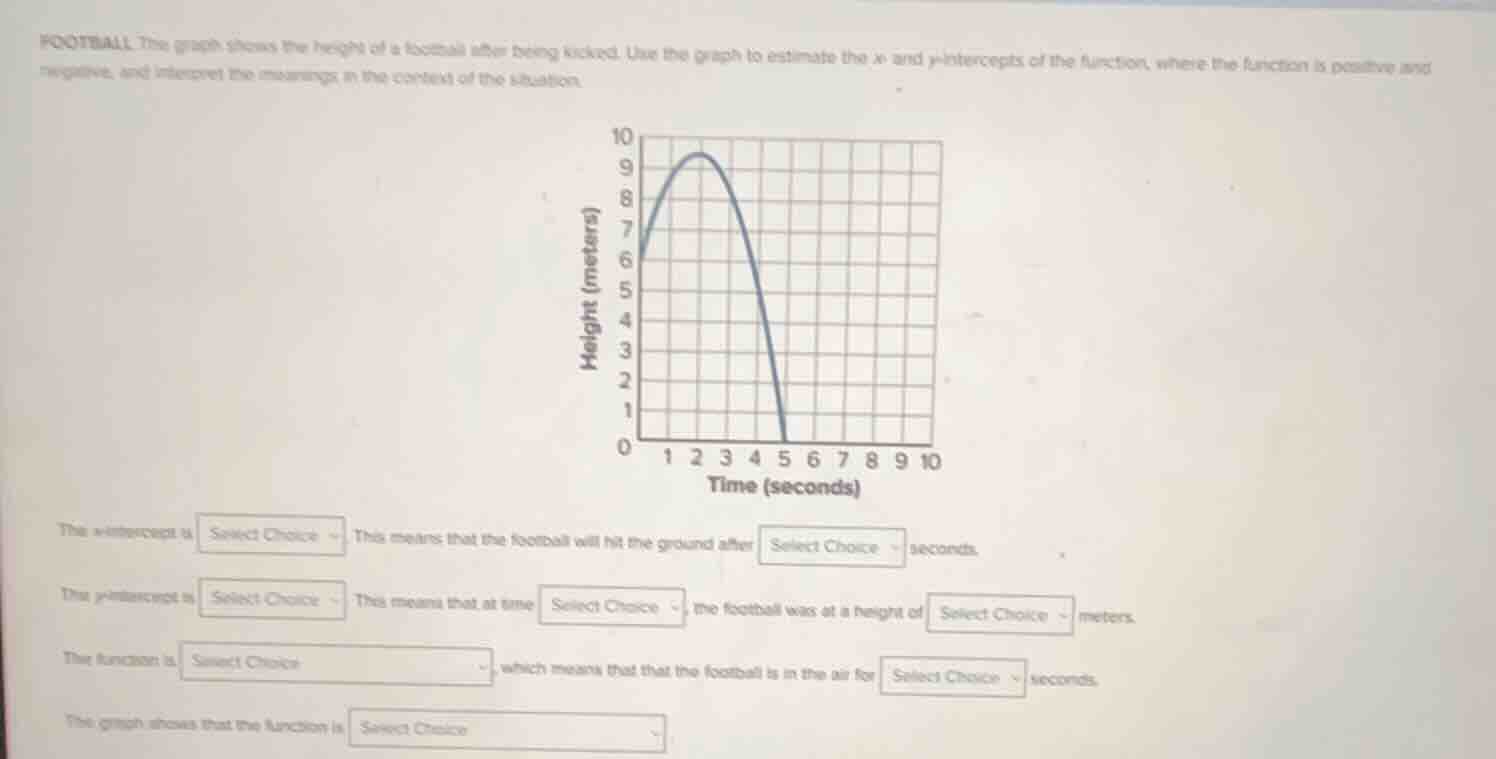
football. the graph shows the height of a football after being kicked. use the graph to estimate the x - and y - intercepts of the function, where the function is positive and negative, and interpret the meanings in the context of the situation.
the x - intercept is select choice. this means that the football will hit the ground after select choice seconds.
the y - intercept is select choice. this means that at time select choice, the football was at a height of select choice meters.
the function is select choice, which means that the football is in the air for select choice seconds.
the graph shows that the function is select choice.
Step1: Identify x - intercept
The x - intercept is the point where the graph crosses the x - axis (where \(y = 0\)). From the graph, we can see that the graph crosses the x - axis at \(x = 5\). So the x - intercept is \(5\). This means that the football will hit the ground after \(5\) seconds.
Step2: Identify y - intercept
The y - intercept is the point where the graph crosses the y - axis (where \(x=0\)). From the graph, when \(x = 0\), the height \(y\) (the value of the y - intercept) is \(6.5\) (approximately, looking at the graph, at \(x = 0\), the height is between \(6\) and \(7\), closer to \(6.5\) or we can see the initial height is around \(6.5\) meters). So the y - intercept is \(6.5\) (or we can say approximately \(6.5\)). This means that at time \(x = 0\) seconds (the time when it is kicked), the football was at a height of \(6.5\) meters.
Step3: Determine when the function is positive
The function (height of the football) is positive when the graph is above the x - axis. Since the x - intercept is at \(x = 5\) and the graph starts at \(x = 0\), the function is positive for \(0\lt x\lt5\). This means that the football is in the air for \(5\) seconds (from \(x = 0\) to \(x = 5\)).
Step4: Analyze the graph's nature
The graph is a parabola opening downwards (since the height first increases and then decreases), so the function is a quadratic function representing the height of the football over time, and it is positive between \(x = 0\) and \(x = 5\).

Snap & solve any problem in the app
Get step-by-step solutions on Sovi AI
Photo-based solutions with guided steps
Explore more problems and detailed explanations
s:
- The x - intercept is \(5\). This means that the football will hit the ground after \(5\) seconds.
- The y - intercept is approximately \(6.5\). This means that at time \(0\) seconds, the football was at a height of \(6.5\) meters.
- The function is positive for \(0\lt x\lt5\), which means that the football is in the air for \(5\) seconds.
- The graph shows that the function is a quadratic function (a parabola) representing the height of the football as a function of time, with a maximum height and then decreasing until it hits the ground at \(x = 5\).