QUESTION IMAGE
Question
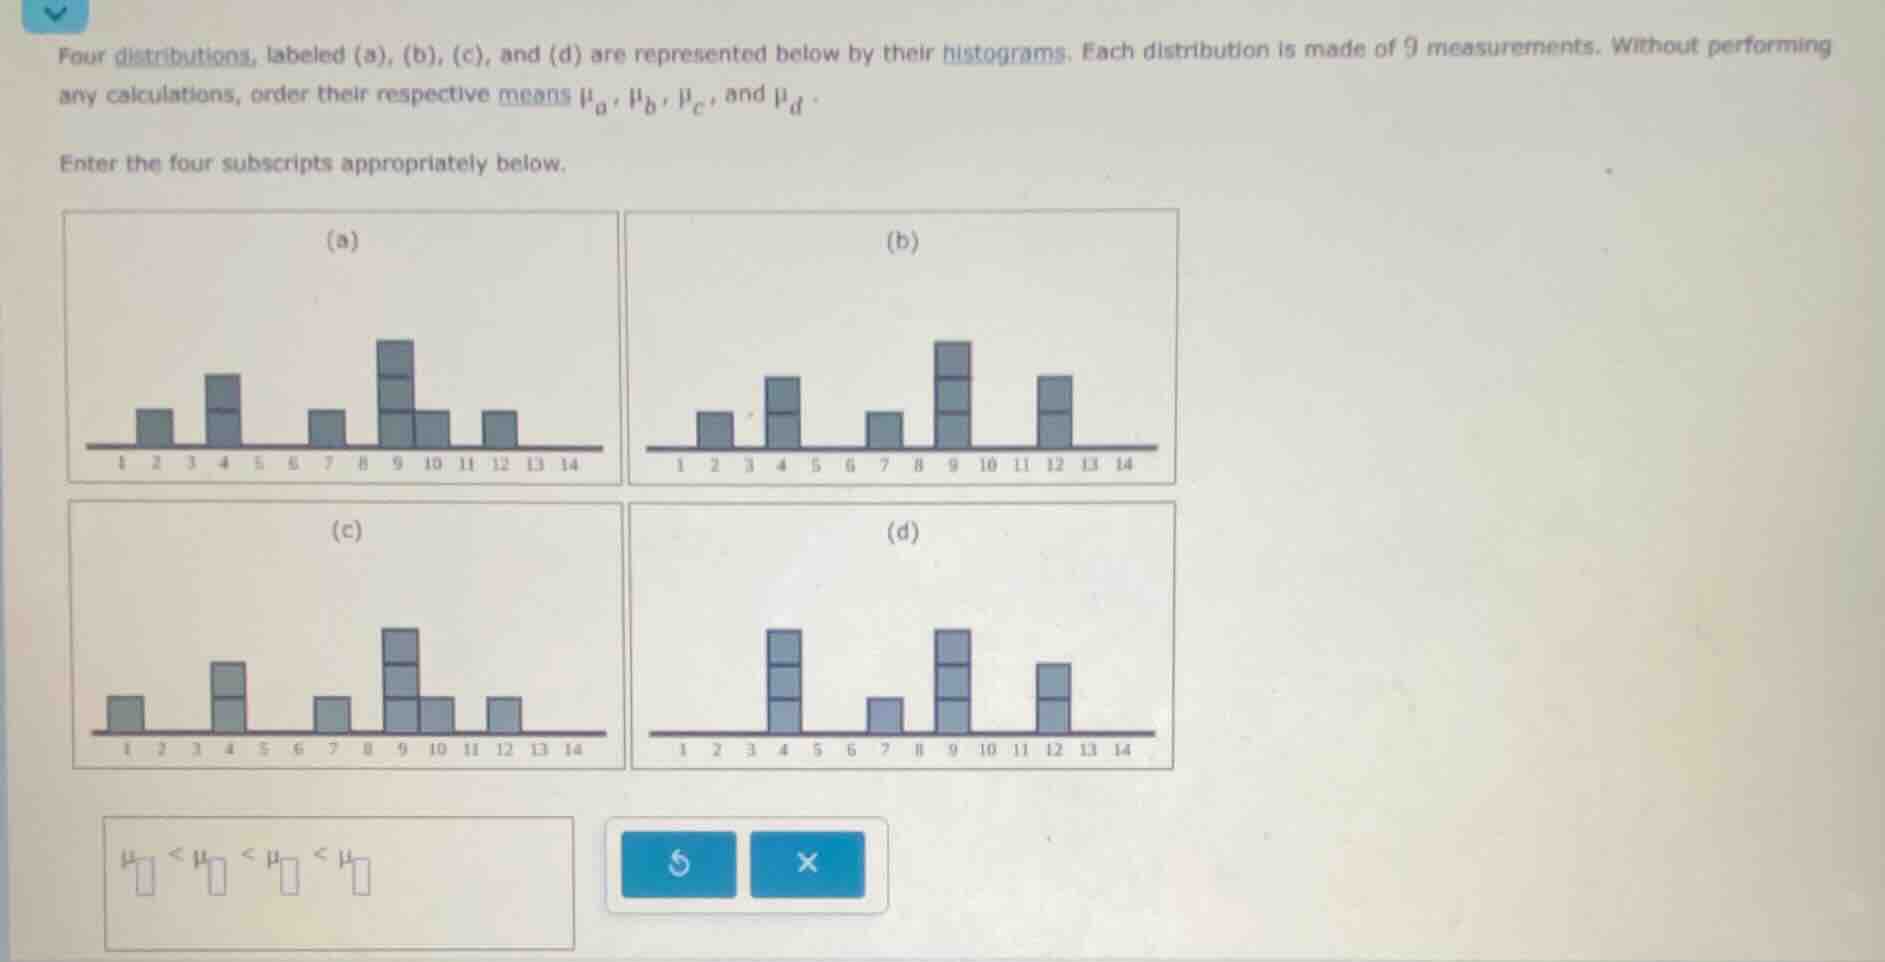
four distributions, labeled (a), (b), (c), and (d) are represented below by their histograms. each distribution is made of 9 measurements. without performing any calculations, order their respective means (mu_a), (mu_b), (mu_c), and (mu_d).
enter the four subscripts appropriately below.
Step1: Analyze Histogram (c)
In histogram (c), the leftmost bar (smallest value) is at 1, and there's a bar at 4. The lower values (left side) have some weight, but let's compare with others. The mean here will be pulled left a bit, but let's check others.
Step2: Analyze Histogram (a)
Histogram (a) has leftmost bar at 2, next at 4. Compared to (c), (a) starts at 2 instead of 1, so its mean should be higher than (c) since the smallest value is larger.
Step3: Analyze Histogram (b)
Histogram (b) has leftmost bar at 2, next at 4, then 7, 10, 12. Wait, no, looking at the x - axis: (b) has bars at 2, 4, 7, 10, 12. Wait, (a) has bars at 2, 4, 7, 9, 12? Wait, no, let's re - examine. The key is the position of the bars (the x - values) and their heights (frequency). For the mean, we can think of the "center of mass" of the histogram. The more weight (higher bars) on the right, the higher the mean; more weight on the left, lower the mean.
Histogram (c): Smallest x - value is 1, then 4, 7, 9, 12. Histogram (a): Smallest x - value is 2, then 4, 7, 9, 12. So (c) has a smaller x - value (1) contributing, so $\mu_c<\mu_a$? Wait, no, wait (d): Let's look at (d). Histogram (d) has bars at 4, 7, 9, 12. Wait, (d) has a bar at 4 (height 3), 7 (height 1), 9 (height 3), 12 (height 2). (b) has bars at 2 (height 1), 4 (height 2), 7 (height 1), 10 (height 3), 12 (height 2). (a) has bars at 2 (height 1), 4 (height 2), 7 (height 1), 9 (height 3), 10 (height 1), 12 (height 1). (c) has bars at 1 (height 1), 4 (height 2), 7 (height 1), 9 (height 3), 10 (height 1), 12 (height 1).
So, for (c): the smallest x is 1, so it has a lower value contributing. For (a): smallest x is 2, so higher than (c). For (b): the peak is at 10 (height 3), and (d): peak at 4 and 9 (height 3 each), but (d) has no bar at 2, while (b) has a bar at 2. Wait, no, let's think about the overall "center".
Histogram (c): Values are 1 (1 time), 4 (2 times), 7 (1 time), 9 (3 times), 10 (1 time), 12 (1 time). Total 1 + 2+1 + 3+1 + 1=9.
Histogram (a): Values are 2 (1 time), 4 (2 times), 7 (1 time), 9 (3 times), 10 (1 time), 12 (1 time). Total 1+2 + 1+3+1+1 = 9.
Histogram (b): Values are 2 (1 time), 4 (2 times), 7 (1 time), 10 (3 times), 12 (2 times). Total 1+2 + 1+3+2=9.
Histogram (d): Values are 4 (3 times), 7 (1 time), 9 (3 times), 12 (2 times). Total 3+1+3+2 = 9.
Now, let's calculate the "weighted" position (even without exact calculation, we can compare).
For (c): The sum of (x frequency) will have a 11 term.
For (a): Sum has 21 term (instead of 11 in (c)), so (a)'s sum is larger than (c)'s, so $\mu_c<\mu_a$.
For (b): The peak is at 10 (frequency 3) and 12 (frequency 2), while (a) has peak at 9 (frequency 3). So (b) has more weight on the right (10 and 12) than (a) (9 and 10, 12). So $\mu_a<\mu_b$.
For (d): Let's see, (d) has values at 4 (3), 7 (1), 9 (3), 12 (2). (b) has values at 2 (1), 4 (2), 7 (1), 10 (3), 12 (2). The 2 in (b) is a small value, but (d) has 4 (3 times) which is a bit left, but (b) has 2 (1 time) and 10 (3 times) vs (d)'s 9 (3 times) and 12 (2 times). Wait, no, let's think of the mean as the average. Let's list the x - values with their frequencies:
- (c): x = 1 (1), 4 (2), 7 (1), 9 (3), 10 (1), 12 (1). Sum = 11+42 + 71+93+101+121=1 + 8+7 + 27+10+12 = 65. Mean = 65/9≈7.22
- (a): x = 2 (1), 4 (2), 7 (1), 9 (3), 10 (1), 12 (1). Sum = 21+42 + 71+93+101+121=2 + 8+7 + 27+10+12 = 66. Mean = 66/9≈7.33
- (b): x = 2 (1), 4 (2), 7 (1), 10 (3), 12 (2). Sum = 21+42 + 71+103+12*2=2 + 8+7 + 30+24 = 71. Mean = 71/9≈7.89
- (d): x = 4 (3), 7 (1), 9 (3…

Snap & solve any problem in the app
Get step-by-step solutions on Sovi AI
Photo-based solutions with guided steps
Explore more problems and detailed explanations
$\mu_{c}<\mu_{a}<\mu_{d}<\mu_{b}$