QUESTION IMAGE
Question
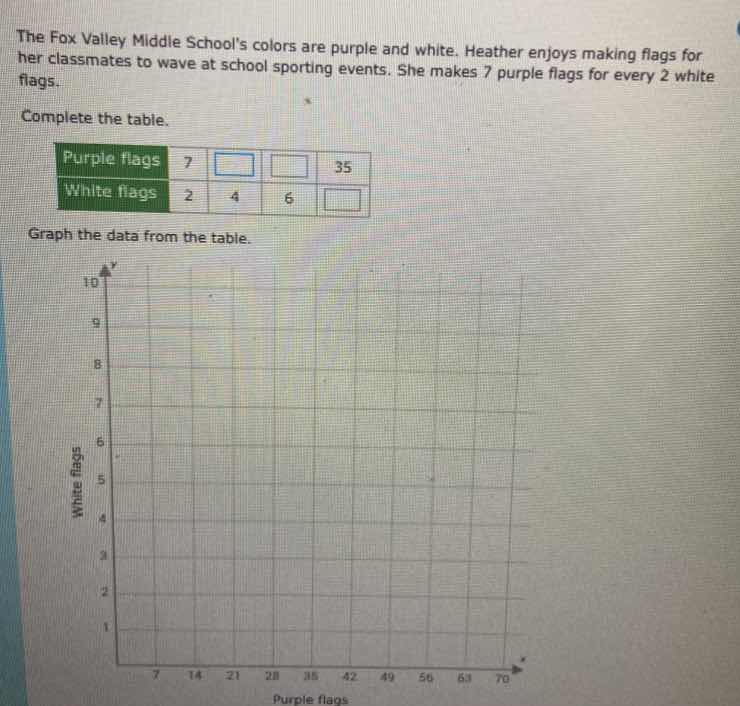
the fox valley middle schools colors are purple and white. heather enjoys making flags for her classmates to wave at school sporting events. she makes 7 purple flags for every 2 white flags.
complete the table.
purple flags 7 \boxed{} \boxed{} 35
white flags 2 4 6 \boxed{}
graph the data from the table.
graph with white flags on y - axis (1 - 10) and purple flags on x - axis (7,14,21,28,35,42,49,56,63,70)
Step1: Identify ratio
The ratio of purple:white flags is $7:2$, so purple = $\frac{7}{2} \times$ white, white = $\frac{2}{7} \times$ purple.
Step2: Find purple for 4 white
Calculate purple flags when white=4:
$\text{Purple} = \frac{7}{2} \times 4 = 14$
Step3: Find purple for 6 white
Calculate purple flags when white=6:
$\text{Purple} = \frac{7}{2} \times 6 = 21$
Step4: Find white for 35 purple
Calculate white flags when purple=35:
$\text{White} = \frac{2}{7} \times 35 = 10$
Step5: Prepare graph points
The coordinate pairs (purple, white) are: $(7,2)$, $(14,4)$, $(21,6)$, $(35,10)$. Plot these on the grid, then draw a straight line through them extending to the axes.

Snap & solve any problem in the app
Get step-by-step solutions on Sovi AI
Photo-based solutions with guided steps
Explore more problems and detailed explanations
Completed Table:
| Purple flags | 7 | 14 | 21 | 35 |
|---|
Graph Instructions:
Plot the points $(7,2)$, $(14,4)$, $(21,6)$, and $(35,10)$ on the provided grid, then draw a straight line connecting these points (extending the line to align with the ratio trend).