QUESTION IMAGE
Question
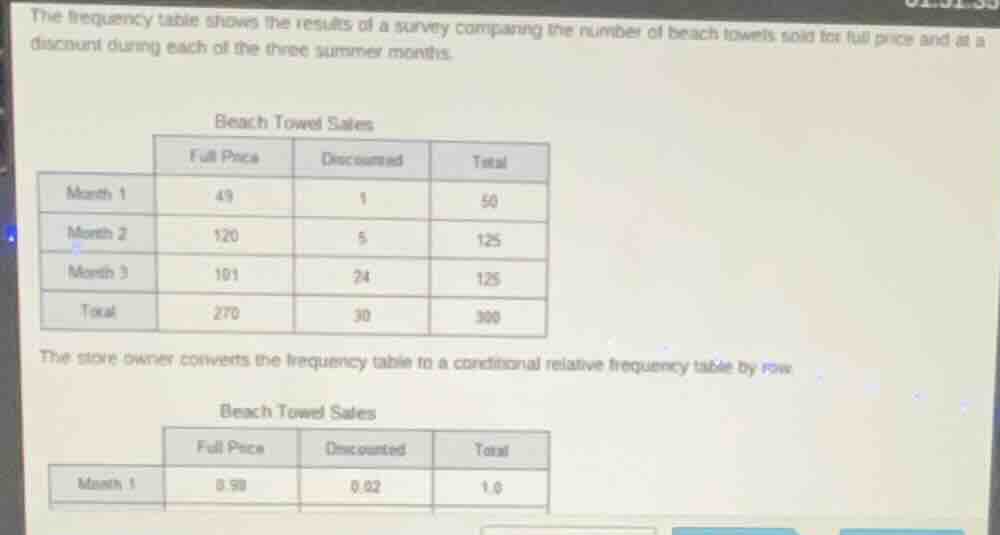
the frequency table shows the results of a survey comparing the number of beach towels sold for full price and at a discount during each of the three summer months.
beach towel sales
| full price | discounted | total | |
|---|---|---|---|
| month 2 | 120 | 5 | 125 |
| month 3 | 101 | 24 | 125 |
| total | 270 | 30 | 300 |
the store owner converts the frequency table to a conditional relative frequency table by row
beach towel sales
| full price | discounted | total |
|---|
(the rest of the conditional relative frequency table for month 2 and month 3 is not fully shown in the ocr text.)
Since the problem seems incomplete (maybe asking to complete the conditional relative frequency table or analyze it), but assuming we need to find the conditional relative frequencies for Month 2 and Month 3 by row (dividing each cell in the row by the row total).
For Month 2:
Step1: Calculate Full Price relative frequency
Row total for Month 2 is 125. Full Price sales: 120. So relative frequency is $\frac{120}{125} = 0.96$
Step2: Calculate Discounted relative frequency
Discounted sales: 5. So relative frequency is $\frac{5}{125} = 0.04$
For Month 3:
Step1: Calculate Full Price relative frequency
Row total for Month 3 is 125. Full Price sales: 101. So relative frequency is $\frac{101}{125} = 0.808$ (or 0.81 if rounded to two decimal places)
Step2: Calculate Discounted relative frequency
Discounted sales: 24. So relative frequency is $\frac{24}{125} = 0.192$ (or 0.19 if rounded to two decimal places)
If the question was to find these values, the completed table (by row) would be:
| Full Price | Discounted | Total | |
|---|---|---|---|
| Month 2 | 0.96 | 0.04 | 1.0 |
| Month 3 | 0.808 | 0.192 | 1.0 |
(Note: Depending on rounding, Month 3 Full Price could be 0.81 and Discounted 0.19)
If you had a specific question (like finding a particular relative frequency), please clarify, but based on typical problems with such tables, this is the calculation for conditional relative frequencies by row.

Snap & solve any problem in the app
Get step-by-step solutions on Sovi AI
Photo-based solutions with guided steps
Explore more problems and detailed explanations
Since the problem seems incomplete (maybe asking to complete the conditional relative frequency table or analyze it), but assuming we need to find the conditional relative frequencies for Month 2 and Month 3 by row (dividing each cell in the row by the row total).
For Month 2:
Step1: Calculate Full Price relative frequency
Row total for Month 2 is 125. Full Price sales: 120. So relative frequency is $\frac{120}{125} = 0.96$
Step2: Calculate Discounted relative frequency
Discounted sales: 5. So relative frequency is $\frac{5}{125} = 0.04$
For Month 3:
Step1: Calculate Full Price relative frequency
Row total for Month 3 is 125. Full Price sales: 101. So relative frequency is $\frac{101}{125} = 0.808$ (or 0.81 if rounded to two decimal places)
Step2: Calculate Discounted relative frequency
Discounted sales: 24. So relative frequency is $\frac{24}{125} = 0.192$ (or 0.19 if rounded to two decimal places)
If the question was to find these values, the completed table (by row) would be:
| Full Price | Discounted | Total | |
|---|---|---|---|
| Month 2 | 0.96 | 0.04 | 1.0 |
| Month 3 | 0.808 | 0.192 | 1.0 |
(Note: Depending on rounding, Month 3 Full Price could be 0.81 and Discounted 0.19)
If you had a specific question (like finding a particular relative frequency), please clarify, but based on typical problems with such tables, this is the calculation for conditional relative frequencies by row.