QUESTION IMAGE
Question
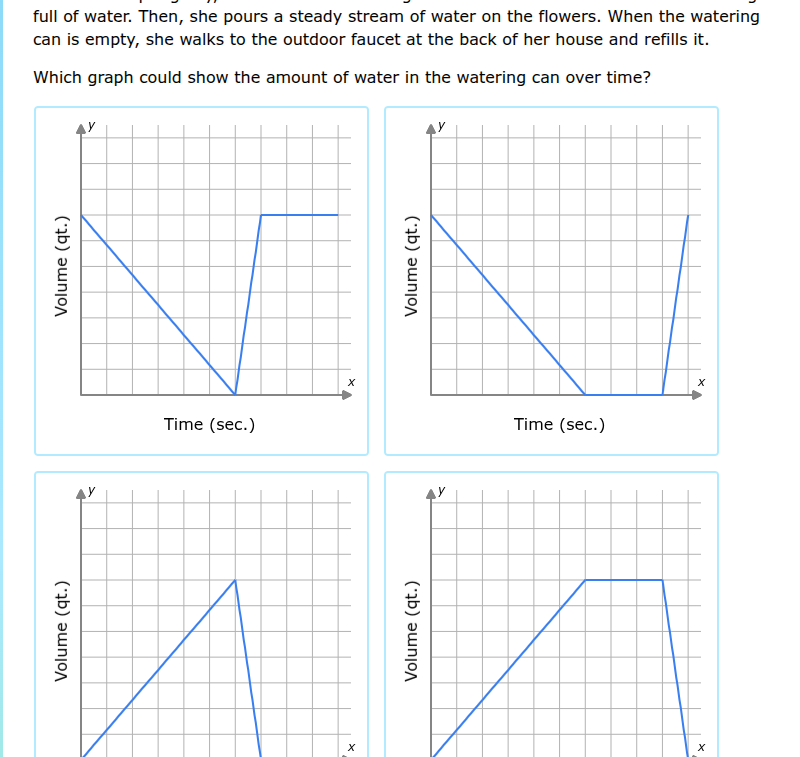
full of water. then, she pours a steady stream of water on the flowers. when the watering can is empty, she walks to the outdoor faucet at the back of her house and refills it. which graph could show the amount of water in the watering can over time?
Step1: Analyze the process
The watering can starts full (so initial volume is high). Then, as she pours water on flowers, the volume decreases steadily until the can is empty. After that, she walks to the faucet and refills it. When refilling, the volume should increase rapidly (since it's a steady stream to refill, but the time to walk and refill: when refilling, the volume goes from 0 to full quickly, and then? Wait, no: wait, the process is: starts full, pours (volume decreases linearly to 0), then walks to faucet (time passes, volume stays 0), then refills (volume increases rapidly to full). Wait, no, the problem says "when the watering can is empty, she walks to the outdoor faucet... and refills it". So after emptying, there's a period (walking) where volume is 0, then refilling (volume goes up quickly to full). Wait, but let's check the graphs.
Wait, first phase: starts full, volume decreases linearly to 0 (so a line with negative slope from high y to (x1, 0)). Second phase: empty, so volume is 0 for some time (horizontal line at y=0). Third phase: refills, so volume increases rapidly (vertical or steep line) back to full (same as initial y). Now let's check the graphs:
First graph: after emptying, it goes up to full and stays? No, because after refilling, does she stop? Wait, the problem says "when the watering can is empty, she walks to... and refills it". So after refilling, what? Wait, maybe the refilling is instantaneous? No, but the key is the shape.
Wait, let's list the graphs:
Top left: starts high, decreases to 0, then increases back to high (steep line) and stays? No, the second part is a steep increase to high, then horizontal. But after refilling, does she use it again? The problem doesn't say. Wait, maybe the process is: full -> pour (decrease to 0) -> refill (increase to full) -> maybe stop? But the graphs:
Top right: starts high, decreases to 0, stays 0 for a while, then increases to high (steep line). That matches: full (high y), pour (decrease to 0, linear), then walk (volume 0, horizontal), then refill (increase to high, steep). Wait, but let's check the other graphs.
Wait, the first graph (top left): after decreasing to 0, it increases back to high and stays. But the problem says "when the watering can is empty, she walks to... and refills it". So after emptying, she refills it. So the sequence is:
- Initial state: full (volume = max).
- Pouring: volume decreases linearly to 0 (time passes, volume goes down).
- Empty: volume = 0, and she walks to faucet (time passes, volume remains 0).
- Refilling: volume increases rapidly to max (since she refills it).
Now, looking at the graphs:
- Top left: after 0, increases to max and stays. But does she start using it again? The problem doesn't say, but maybe the refilling is to full, and then maybe the graph ends? Wait, no, the question is which graph could show the amount over time.
Wait, let's check the top right graph:
- Starts high (full), decreases linearly to 0 (negative slope), then stays 0 (horizontal line), then increases rapidly to high (positive steep slope). That matches the process: full -> pour (decrease to 0) -> walk (volume 0) -> refill (increase to full).
Wait, but the top left graph: after decreasing to 0, it increases to full (steep line) and then stays. But the problem doesn't say she uses it again. But maybe the refilling is to full, and then the graph stops? Wait, maybe I misread. Let's re-examine the problem: "Which graph could show the amount of water in the watering can over time?"
Let's analyze each graph:
- Top left: star…

Snap & solve any problem in the app
Get step-by-step solutions on Sovi AI
Photo-based solutions with guided steps
Explore more problems and detailed explanations
The graph in the top right (the second graph in the top row) which shows volume starting high, decreasing linearly to 0, staying at 0 for a period, then increasing rapidly back to high.