QUESTION IMAGE
Question
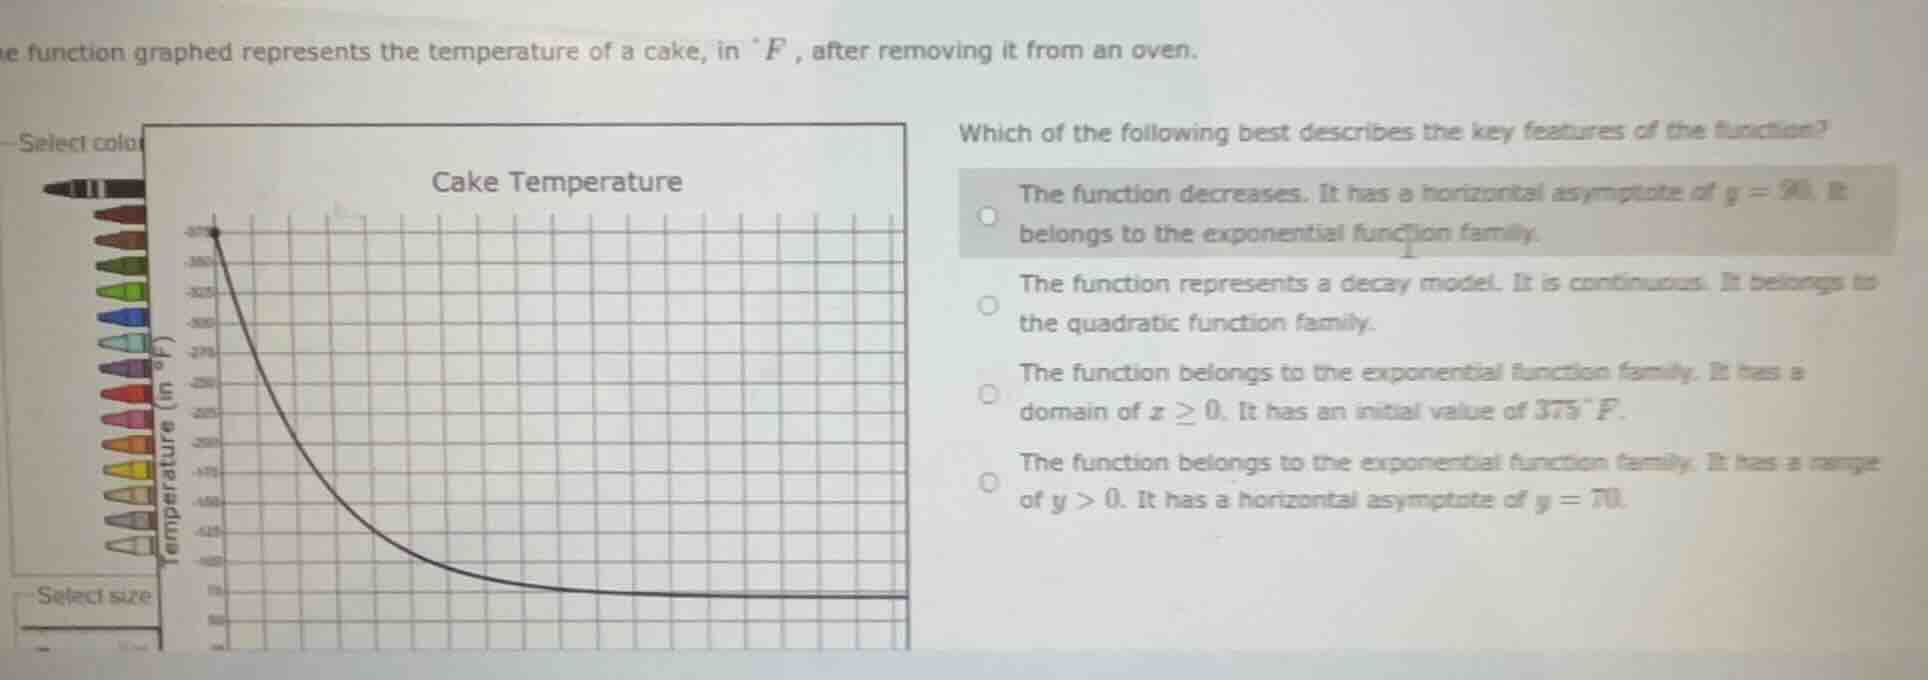
the function graphed represents the temperature of a cake, in °f, after removing it from an oven. which of the following best describes the key features of the function? cake temperature graph the function decreases. it has a horizontal asymptote of y = 80. it belongs to the exponential function family. the function represents a decay model. it is continuous. it belongs to the quadratic function family. the function belongs to the exponential function family. it has a domain of x ≥ 0. it has an initial value of 375°f. the function belongs to the exponential function family. it has a range of y > 0. it has a horizontal asymptote of y = 70.
- First, identify the initial value: the graph starts at (0, 375), so the initial temperature is 375°F.
- The domain is $x \geq 0$ because time (x-axis) cannot be negative.
- The curve shape matches exponential decay, so it belongs to the exponential function family.
- Eliminate incorrect options:
- Option 1: The horizontal asymptote is y=70, not 20.
- Option 2: It is exponential, not quadratic.
- Option 4: The range is $y > 70$ (not $y>0$), as the temperature approaches 70°F, not 0.

Snap & solve any problem in the app
Get step-by-step solutions on Sovi AI
Photo-based solutions with guided steps
Explore more problems and detailed explanations
The function belongs to the exponential function family. It has a domain of $x \geq 0$. It has an initial value of $375^\circ F$.