QUESTION IMAGE
Question
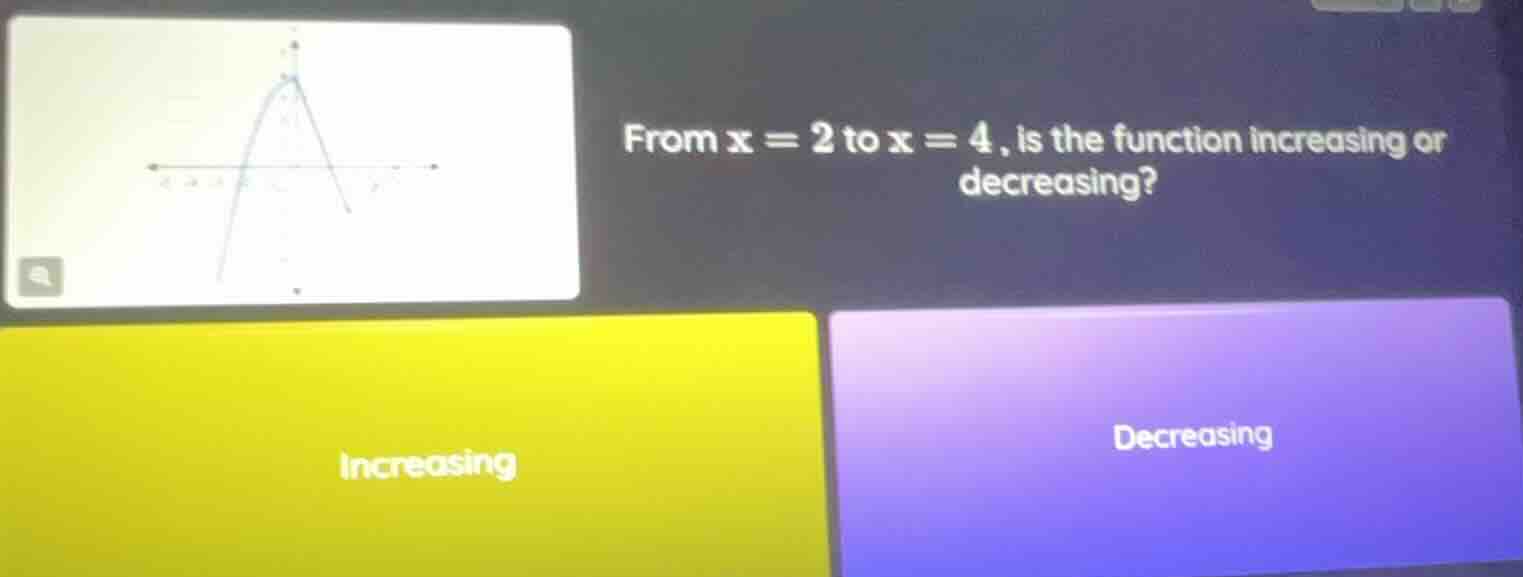
from x = 2 to x = 4, is the function increasing or decreasing?
Step1: Analyze the graph's shape
The graph shown is a parabola opening downward (since it has a peak). The vertex (peak) is at some x - value. From the graph, we can see that to the right of the vertex (as x increases past the vertex), the function's y - values decrease as x increases.
Step2: Check the interval from x = 2 to x = 4
We observe the behavior of the function between x = 2 and x = 4. Since the vertex (the maximum point) is to the left of or at x = 2 (from the graph's shape), as x goes from 2 to 4 (moving to the right), the y - value of the function is getting smaller. So the function is decreasing on the interval from x = 2 to x = 4.

Snap & solve any problem in the app
Get step-by-step solutions on Sovi AI
Photo-based solutions with guided steps
Explore more problems and detailed explanations
Decreasing (the option with "Decreasing" text)