QUESTION IMAGE
Question
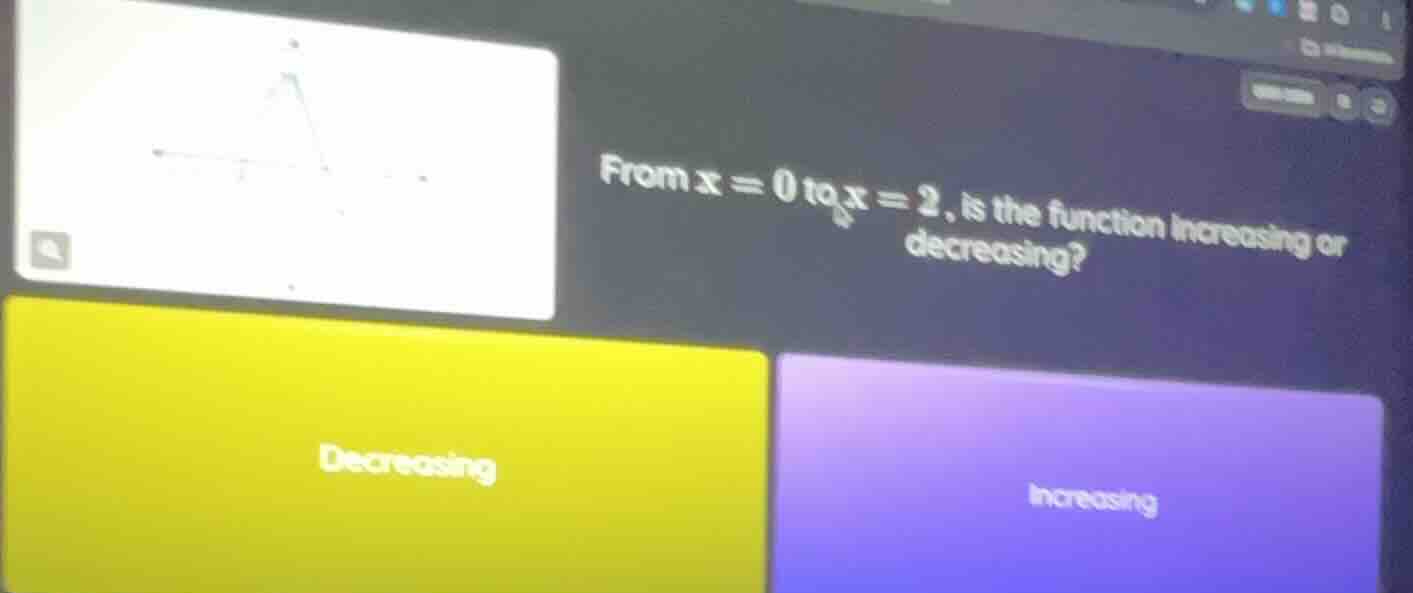
from x = 0 to x = 2, is the function increasing or decreasing? decreasing increasing
Step1: Recall function trend definition
A function is increasing on an interval if, as \( x \) increases (from left to right), \( y \)-values (outputs) also increase. A function is decreasing if \( y \)-values decrease as \( x \) increases.
Step2: Analyze the graph (from description)
The graph shown (a triangle - like or a line - segment - based graph) from \( x = 0 \) to \( x = 2 \): when we move from \( x = 0 \) (left) to \( x = 2 \) (right) along the \( x \)-axis, we observe the \( y \)-values. If the graph is going up ( \( y \) increases with \( x \) ), it's increasing; if going down, decreasing. From the visual (the left part of the graph, likely a rising line from \( x = 0 \) towards the peak, but wait, wait - no, wait the options: but actually, in the interval from \( x = 0 \) to \( x = 2 \), if the graph's \( y \)-value rises as \( x \) goes from 0 to 2, then it's increasing. Wait, maybe the graph is a line that goes up from \( x = 0 \) to some point, but in the interval \( [0,2] \), when \( x \) increases from 0 to 2, the \( y \)-coordinate increases. So the function is increasing.

Snap & solve any problem in the app
Get step-by-step solutions on Sovi AI
Photo-based solutions with guided steps
Explore more problems and detailed explanations
Increasing (corresponding to the purple option labeled "Increasing")