QUESTION IMAGE
Question
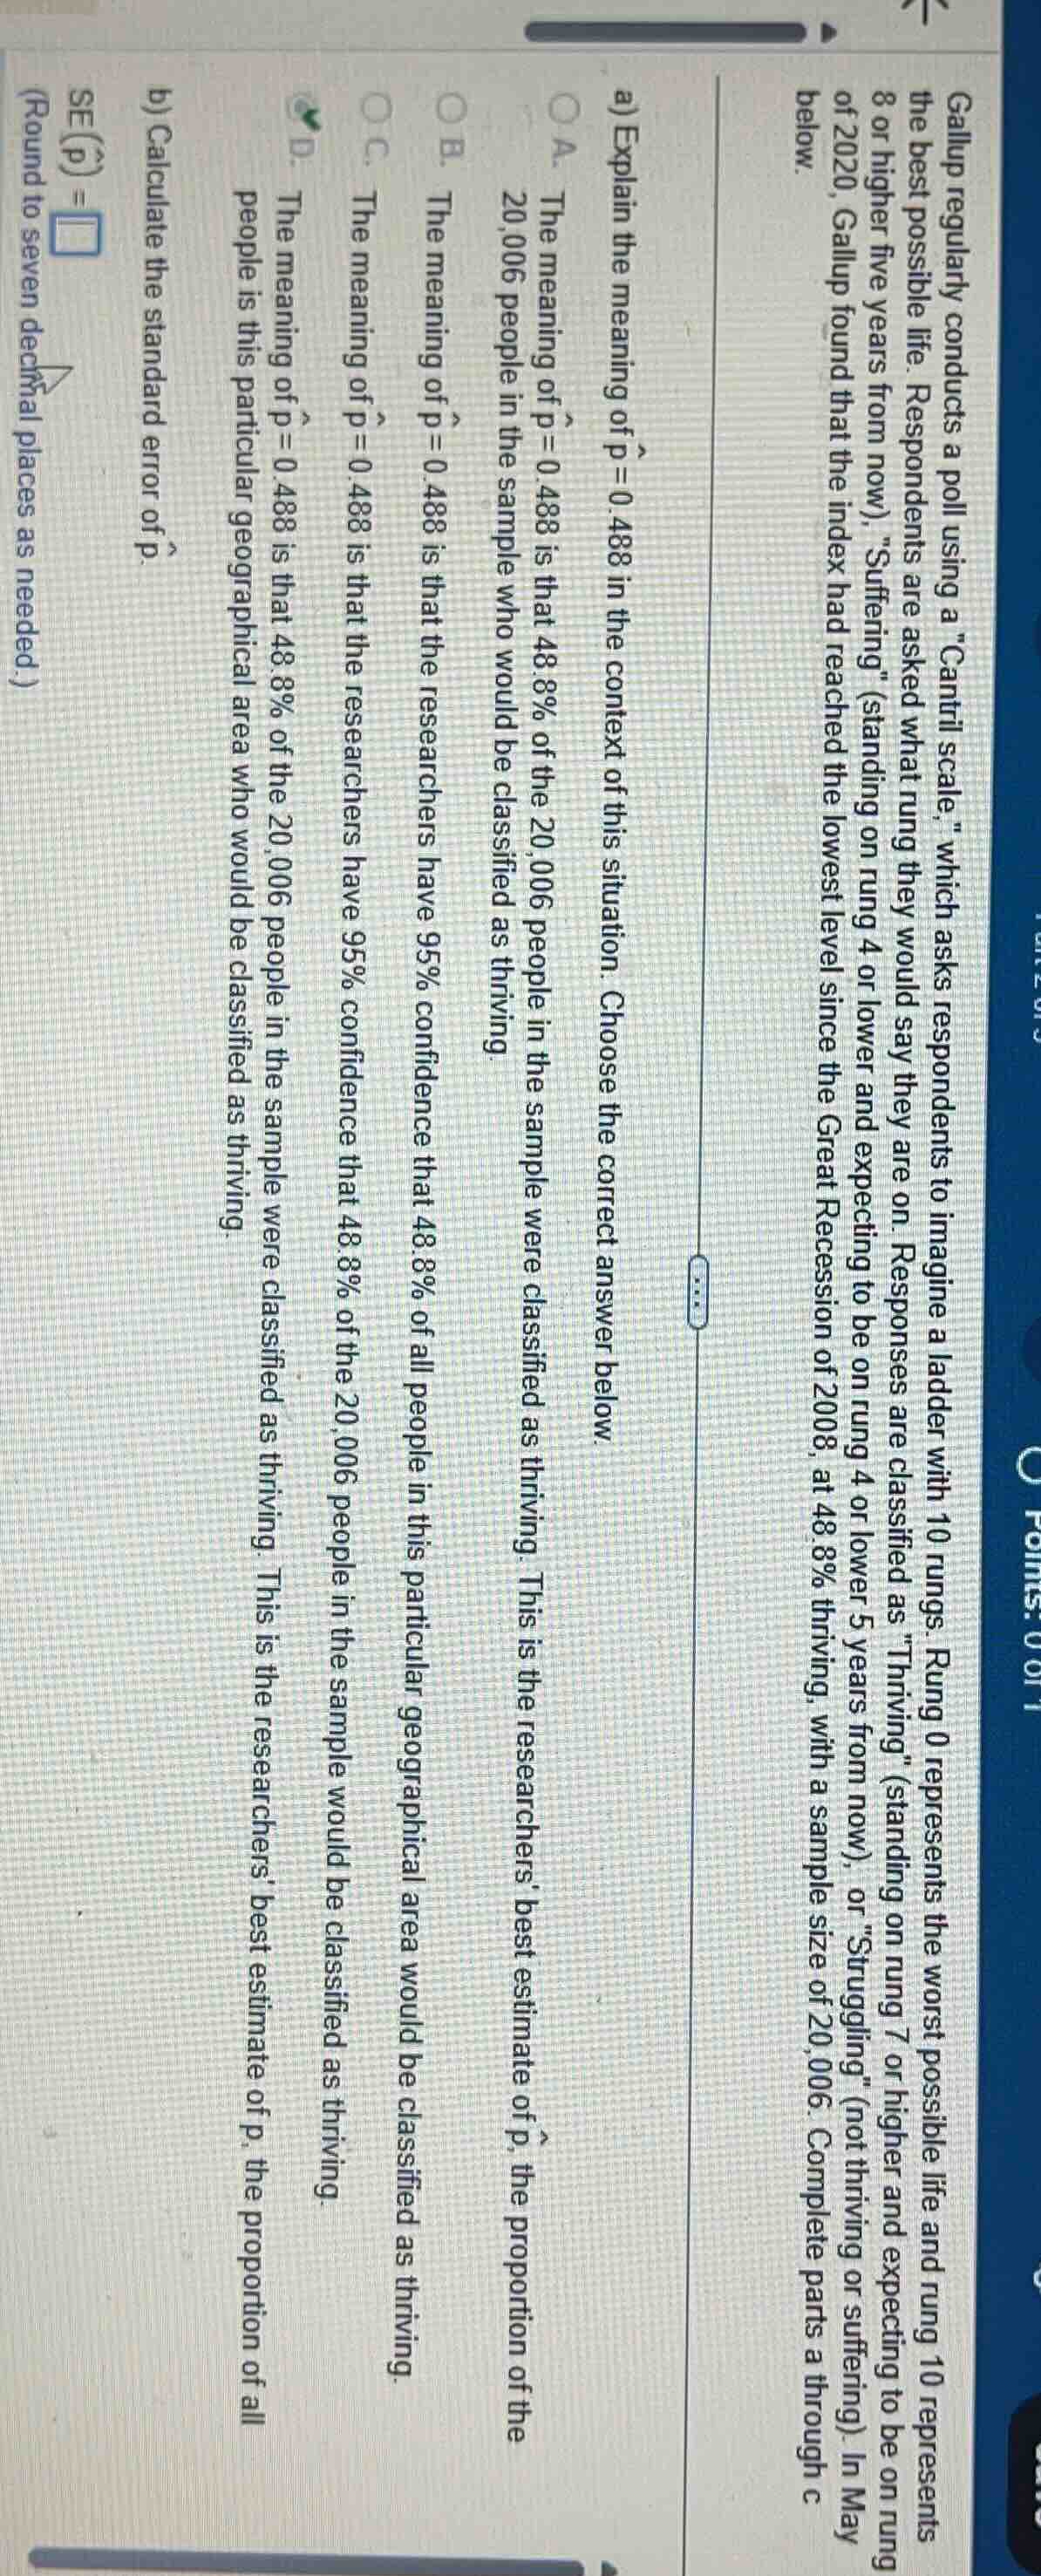
gallup regularly conducts a poll using a \cantril scale,\ which asks respondents to imagine a ladder with 10 rungs. rung 0 represents the worst possible life and rung 10 represents the best possible life. respondents are asked what rung they would say they are on. responses are classified as \thriving\ (standing on rung 7 or higher and expecting to be on rung 8 or higher five years from now), \suffering\ (standing on rung 4 or lower and expecting to be on rung 4 or lower five years from now), or \struggling\ (not thriving or suffering). in may of 2020, gallup found that the index had reached the lowest level since the great recession of 2008, at 48.8% thriving, with a sample size of 20,006. complete parts a through c.
a) explain the meaning of \\(\hat{p} = 0.488\\) in the context of this situation. choose the correct answer below.
a. the meaning of \\(\hat{p} = 0.488\\) is that 48.8% of the 20,006 people in the sample were classified as thriving. this is the researchers best estimate of \\(\hat{p}\\), the proportion of the 20,006 people in the sample who would be classified as thriving.
b. the meaning of \\(\hat{p} = 0.488\\) is that the researchers have 95% confidence that 48.8% of all people in this particular geographical area would be classified as thriving.
c. the meaning of \\(\hat{p} = 0.488\\) is that the researchers have 95% confidence that 48.8% of the 20,006 people in the sample would be classified as thriving.
d. the meaning of \\(\hat{p} = 0.488\\) is that 48.8% of the 20,006 people in the sample were classified as thriving. this is the researchers best estimate of \\(p\\), the proportion of all people in this particular geographical area who would be classified as thriving.
b) calculate the standard error of \\(\hat{p}\\).
\\(\text{se}(\hat{p}) = \square\\)
(round to seven decimal places as needed.)
Step1: Identify correct meaning of $\hat{p}$
$\hat{p}$ is the sample proportion, which estimates the population proportion. 48.8% of the 20,006 sample people are thriving, and this is the best estimate of the population proportion $p$.
Step2: Calculate standard error of $\hat{p}$
Use the formula for standard error of a sample proportion: $SE(\hat{p}) = \sqrt{\frac{\hat{p}(1-\hat{p})}{n}}$, where $\hat{p}=0.488$, $n=20006$.
First compute $1-\hat{p}=1-0.488=0.512$.
Then calculate $\hat{p}(1-\hat{p})=0.488\times0.512=0.249856$.
Next compute $\frac{0.249856}{20006}\approx0.000012489$.
Finally take the square root: $\sqrt{0.000012489}\approx0.003534$.

Snap & solve any problem in the app
Get step-by-step solutions on Sovi AI
Photo-based solutions with guided steps
Explore more problems and detailed explanations
a) D. The meaning of $\hat{p}=0.488$ is that 48.8% of the 20,006 people in the sample were classified as thriving. This is the researchers' best estimate of $p$, the proportion of all people is this particular geographical area who would be classified as thriving.
b) $0.0035340$