QUESTION IMAGE
Question
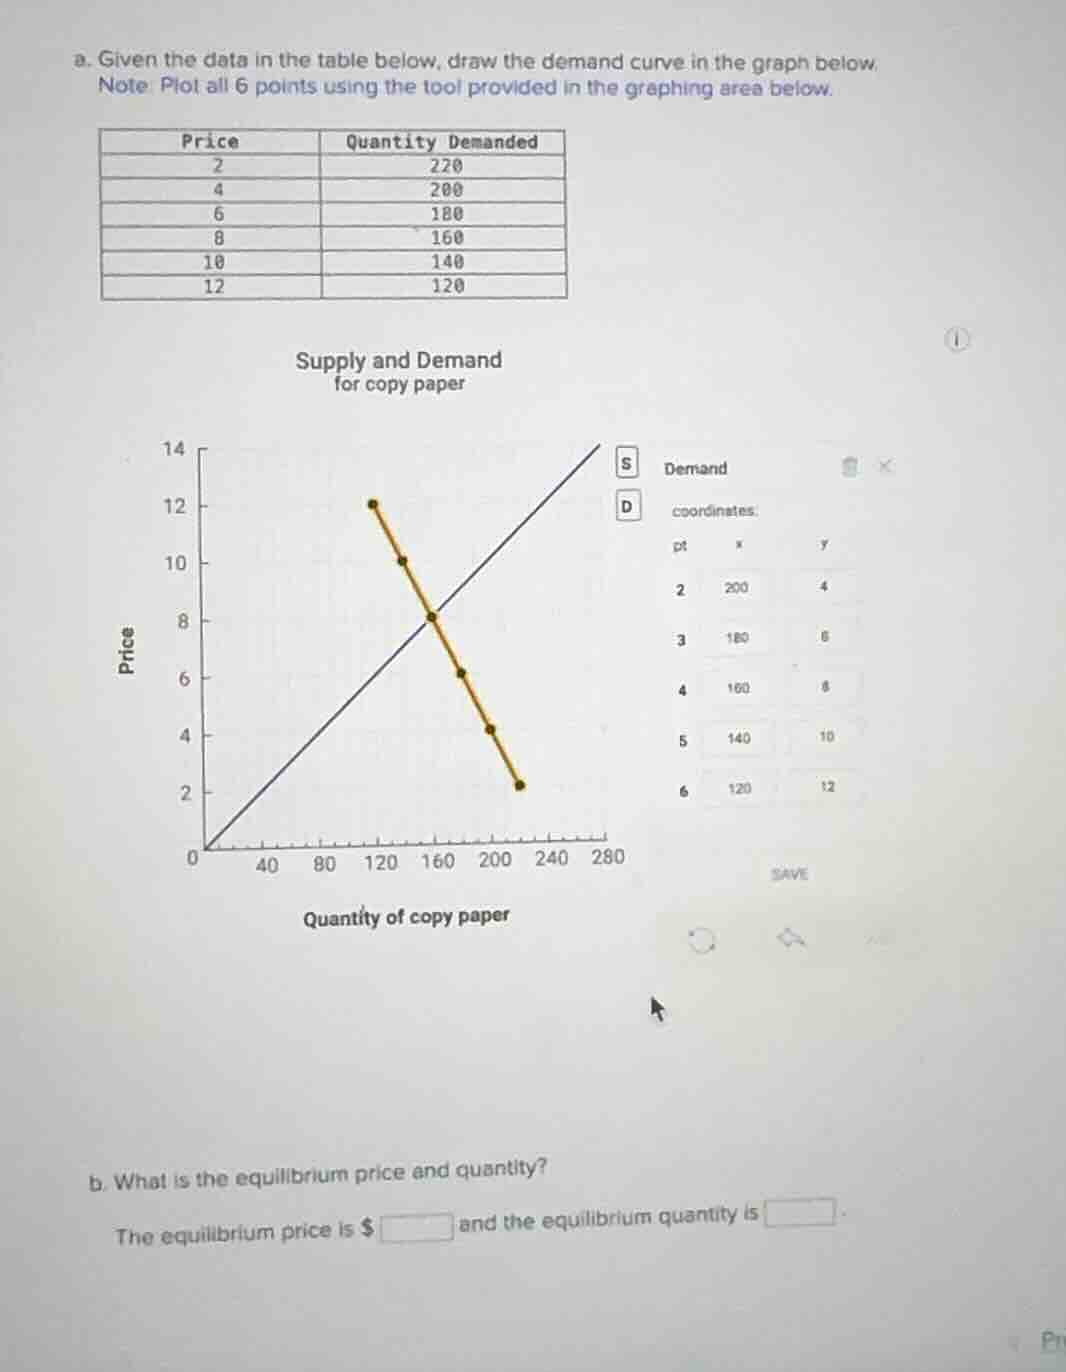
a. given the data in the table below, draw the demand curve in the graph below. note: plot all 6 points using the tool provided in the graphing area below. \
\
supply and demand for copy paper \
(graph with price on y - axis and quantity of copy paper on x - axis, supply and demand curves) \
b. what is the equilibrium price and quantity? \
the equilibrium price is $\square$ and the equilibrium quantity is $\square$.
Step1: Identify equilibrium intersection
The equilibrium is where the supply and demand curves cross. From the graph, this point has coordinates (160, 8).
Step2: Match to price/quantity
On the graph, the vertical axis is Price ($y$-value) and horizontal axis is Quantity ($x$-value). So the $y$-value is equilibrium price, $x$-value is equilibrium quantity.

Snap & solve any problem in the app
Get step-by-step solutions on Sovi AI
Photo-based solutions with guided steps
Explore more problems and detailed explanations
The equilibrium price is $\$8$ and the equilibrium quantity is $160$.
For part (a), the correct 6 points to plot are:
- (220, 2)
- (200, 4)
- (180, 6)
- (160, 8)
- (140, 10)
- (120, 12)
Connecting these points forms the correct downward-sloping demand curve.