QUESTION IMAGE
Question
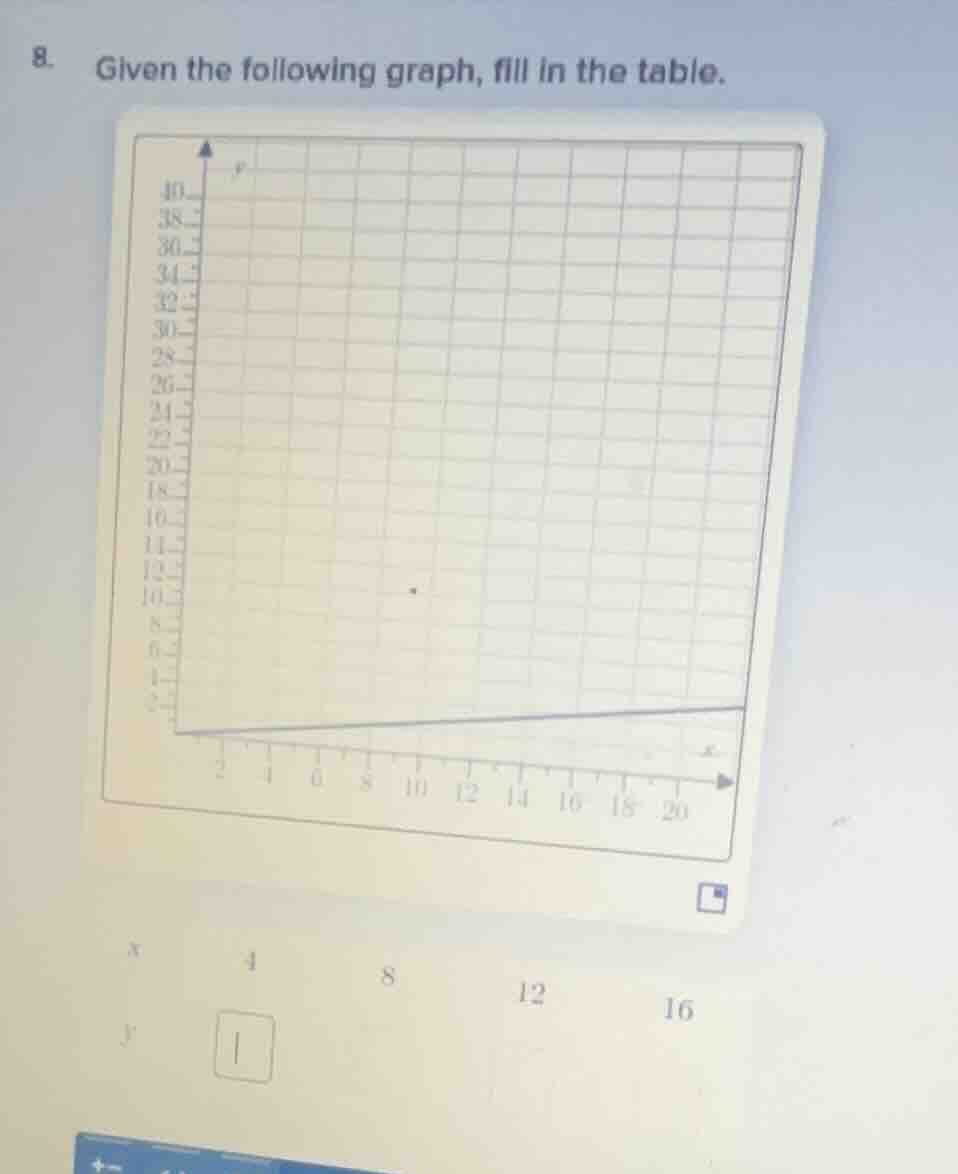
- given the following graph, fill in the table.
x | 4 | 8 | 12 | 16
y | | | |
Step1: Identify line equation form
The graph is a straight line through the origin, so it follows $y = mx$, where $m$ is the slope.
Step2: Calculate slope from plotted point
Use the point $(x=10, y=10)$ from the graph:
$m = \frac{y}{x} = \frac{10}{10} = 1$
Wait, correction: Recheck the graph, the line at $x=20$ has $y=2$, so use $(20, 2)$:
$m = \frac{2}{20} = \frac{1}{10}$
Step3: Compute y for x=4
Substitute $x=4$ into $y = \frac{1}{10}x$:
$y = \frac{1}{10} \times 4 = 0.4$
Step4: Compute y for x=8
Substitute $x=8$ into $y = \frac{1}{10}x$:
$y = \frac{1}{10} \times 8 = 0.8$
Step5: Compute y for x=12
Substitute $x=12$ into $y = \frac{1}{10}x$:
$y = \frac{1}{10} \times 12 = 1.2$
Step6: Compute y for x=16
Substitute $x=16$ into $y = \frac{1}{10}x$:
$y = \frac{1}{10} \times 16 = 1.6$

Snap & solve any problem in the app
Get step-by-step solutions on Sovi AI
Photo-based solutions with guided steps
Explore more problems and detailed explanations
| $x$ | 4 | 8 | 12 | 16 |
|---|