QUESTION IMAGE
Question
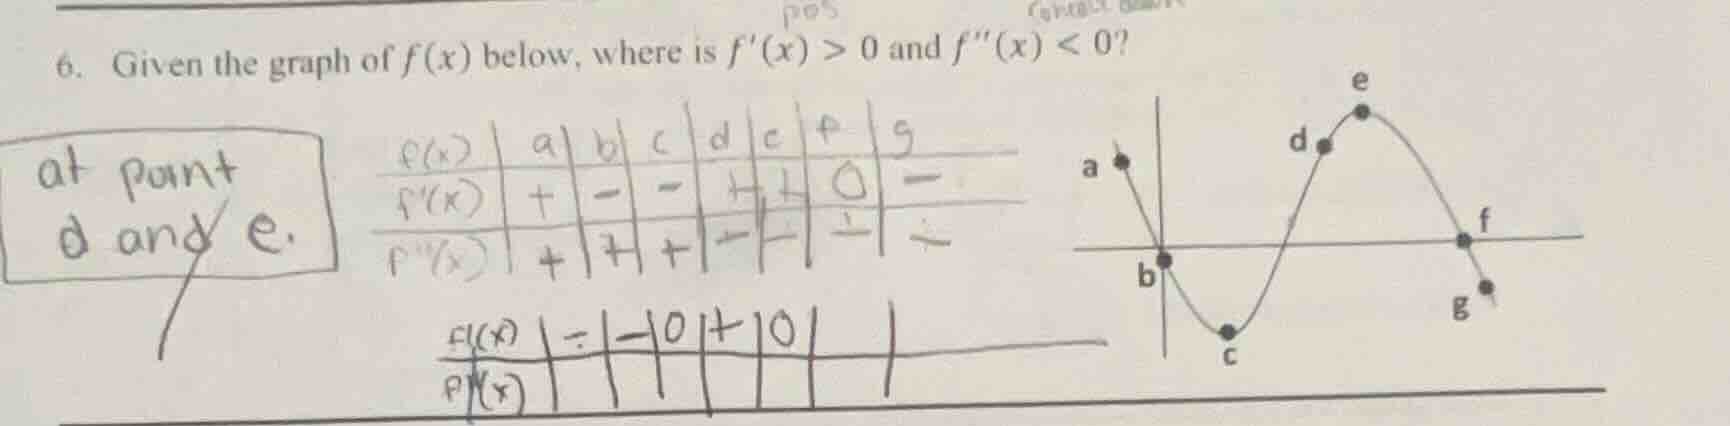
- given the graph of ( f(x) ) below, where is ( f(x) > 0 ) and ( f(x) < 0 )?
Step1: Interpret $f'(x) > 0$
$f'(x) > 0$ means the function $f(x)$ is increasing (the graph rises as $x$ increases).
Step2: Interpret $f''(x) < 0$
$f''(x) < 0$ means the function $f(x)$ is concave down (the graph curves downward, like a hill).
Step3: Match to the graph
- From point $d$ to $e$: The graph rises (so $f'(x) > 0$) and curves downward (so $f''(x) < 0$). At the single point $d$, the function is increasing and concave down; at point $e$, $f'(x)=0$ (it's a peak), so $e$ does not satisfy $f'(x) > 0$.

Snap & solve any problem in the app
Get step-by-step solutions on Sovi AI
Photo-based solutions with guided steps
Explore more problems and detailed explanations
On the interval between point $d$ and point $e$ (or specifically at point $d$, as $e$ is a critical point where $f'(x)=0$)