QUESTION IMAGE
Question
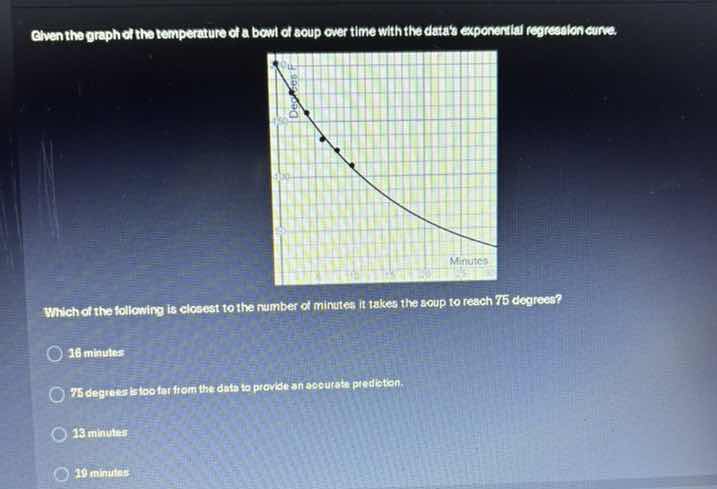
given the graph of the temperature of a bowl of soup over time with the datas exponential regression curve.
which of the following is closest to the number of minutes it takes the soup to reach 75 degrees?
16 minutes
75 degrees is too far from the data to provide an accurate prediction.
13 minutes
19 minutes
Step1: Locate 75 on y-axis
Identify the vertical position for 75 degrees on the graph's temperature axis.
Step2: Find intersection with regression curve
Trace horizontally from 75 to meet the exponential regression line, then trace down to the x-axis (minutes).
Step3: Match to closest option
The x-axis value at this intersection is closest to 13 minutes.

Snap & solve any problem in the app
Get step-by-step solutions on Sovi AI
Photo-based solutions with guided steps
Explore more problems and detailed explanations
13 minutes