QUESTION IMAGE
Question
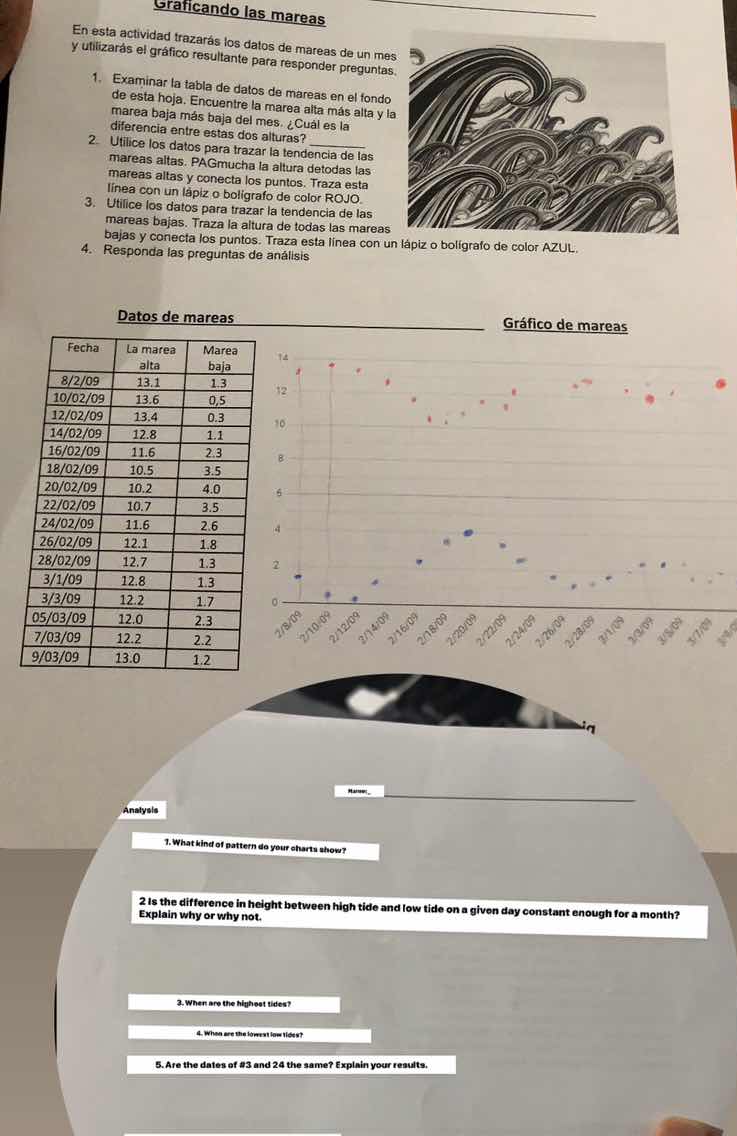
gráficando las mareas
en esta actividad trazarás los datos de mareas de un mes
y utilizarás el gráfico resultante para responder preguntas.
- examinar la tabla de datos de mareas en el fondo
de esta hoja. encuentre la marea alta más alta y la
marea baja más baja del mes. ¿cuál es la
diferencia entre estas dos alturas?
- utilice los datos para trazar la tendencia de las
mareas altas. págamecha la altura de todas las
mareas altas y conecta los puntos. traza esta
línea con un lápiz o bolígrafo de color rojo.
- utilice los datos para trazar la tendencia de las
mareas bajas. traza la altura de todas las mareas
bajas y conecta los puntos. traza esta línea con un lápiz o bolígrafo de color azul.
- responda las preguntas de análisis
datos de mareas
fecha\tla marea alta\tmarea baja
8/2/09\t13.1\t1.3
10/02/09\t13.6\t0.5
12/02/09\t13.4\t0.3
14/02/09\t12.8\t1.1
16/02/09\t11.6\t2.3
18/02/09\t10.5\t4.0
20/02/09\t10.2\t3.5
22/02/09\t10.7\t3.5
24/02/09\t11.6\t2.6
26/02/09\t12.1\t1.8
28/02/09\t12.7\t1.3
3/1/09\t12.8\t1.3
3/3/09\t12.2\t1.7
05/03/09\t12.0\t2.3
7/03/09\t12.2\t2.2
9/03/09\t13.0\t1.2
gráfico de mareas
gráfico con eje y de 0 a 14 y eje x con fechas desde 2/8/09 hasta 9/3/09, con puntos rojos y azules
análisis
- what kind of pattern do your charts show?
- is the difference in height between high tide and low tide on a given day constant enough for a month? explain why or why not.
- when are the highest tides?
- when are the lowest low tides?
- are the dates of #3 and #4 the same? explain your results.
Question 1: What kind of pattern do your charts show?
To determine the pattern, we analyze the high - tide (red - plotted) and low - tide (blue - plotted) data over time. Looking at the high - tide values, we can see that they generally follow a cyclical pattern. There are periods of increase and then decrease, and this cycle repeats. For the low - tide values, a similar cyclical pattern is observed, with fluctuations in the height of low tides over the days. Also, we can notice that the high - tide and low - tide values seem to have an inverse relationship to some extent; when high tides are relatively high, low tides may be relatively low and vice - versa, although this is not a strict inverse relationship. Overall, the pattern is a cyclical (periodic) fluctuation in both high - tide and low - tide heights over the month, with some correlation between the two (high and low tides).
To find the difference between high tide (\(H\)) and low tide (\(L\)) for each day, we use the formula \(D = H - L\). Let's calculate the differences for a few days:
- On 8/2/09: \(D=13.1 - 1.3 = 11.8\)
- On 10/02/09: \(D = 13.6-0.5 = 13.1\)
- On 12/02/09: \(D=13.4 - 0.3 = 13.1\)
- On 14/02/09: \(D = 12.8-1.1 = 11.7\)
- On 16/02/09: \(D=11.6 - 2.3 = 9.3\)
We can see that the differences vary significantly from day to day (e.g., from 9.3 to 13.1). The difference is not constant because the heights of high tides and low tides themselves are not constant; they fluctuate in a cyclical manner, so their difference also changes. Tidal heights are affected by various factors such as the position of the moon and sun (lunar and solar gravitational forces), the shape of the coastline, and the depth of the ocean in the area. These factors change over time, leading to changes in both high and low tide heights and thus their difference.
We look at the "La marea alta" (high tide) column in the "Datos de mareas" table. The highest high - tide value is 13.6 (on 10/02/09) and 13.4 (on 12/02/09) and 13.1 (on 8/2/09) are also relatively high. Looking at the later dates, on 9/03/09, the high tide is 13.0. So, the highest tides occur around the early part of February (10/02/09, 12/02/09, 8/2/09) and also towards the end of the period (around 9/03/09) as the high - tide values start to increase again. From the graph, the red - plotted (high - tide) points are highest around these early February dates and then show a trend of increasing again towards the end of the month - long period.

Snap & solve any problem in the app
Get step-by-step solutions on Sovi AI
Photo-based solutions with guided steps
Explore more problems and detailed explanations
The charts show a cyclical (periodic) pattern of fluctuation in both high - tide and low - tide heights over the month. High and low tides exhibit periods of increase and decrease, and there is a somewhat inverse relationship between high - tide and low - tide heights (though not strictly so).