QUESTION IMAGE
Question
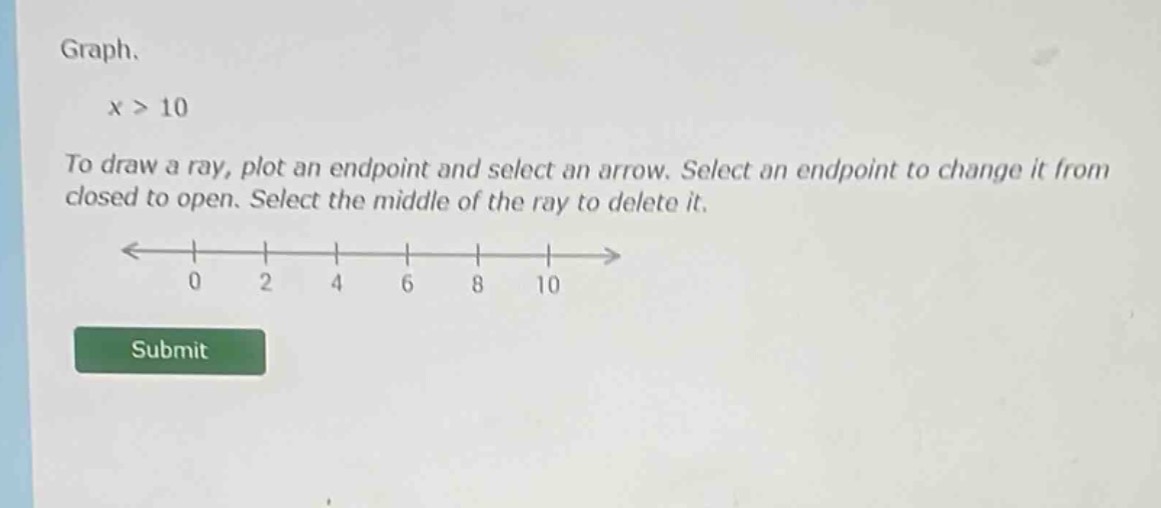
graph.
x > 10
to draw a ray, plot an endpoint and select an arrow. select an endpoint to change it from closed to open. select the middle of the ray to delete it.
0 2 4 6 8 10
submit
Step1: Analyze the inequality
The inequality is \( x > 10 \). This means we need to represent all real numbers greater than 10 on the number line.
Step2: Determine the endpoint type
Since the inequality is strict (\(>\), not \(\geq\)), the endpoint at 10 should be an open circle (to indicate that 10 is not included in the solution set).
Step3: Draw the ray
We place an open circle at 10 and then draw a ray starting from this open circle and extending to the right (towards positive infinity) to represent all numbers greater than 10.
(Note: Since this is a graphical task, the actual drawing would involve interacting with the provided number line interface. The steps above describe the conceptual process for creating the correct graph.)

Snap & solve any problem in the app
Get step-by-step solutions on Sovi AI
Photo-based solutions with guided steps
Explore more problems and detailed explanations
To graph \( x > 10 \):
- Locate 10 on the number line.
- Place an open circle at 10 (because \( x \) is strictly greater than 10, so 10 is not included).
- Draw a ray starting from the open circle at 10 and pointing to the right (towards values greater than 10) to represent all numbers greater than 10.