QUESTION IMAGE
Question
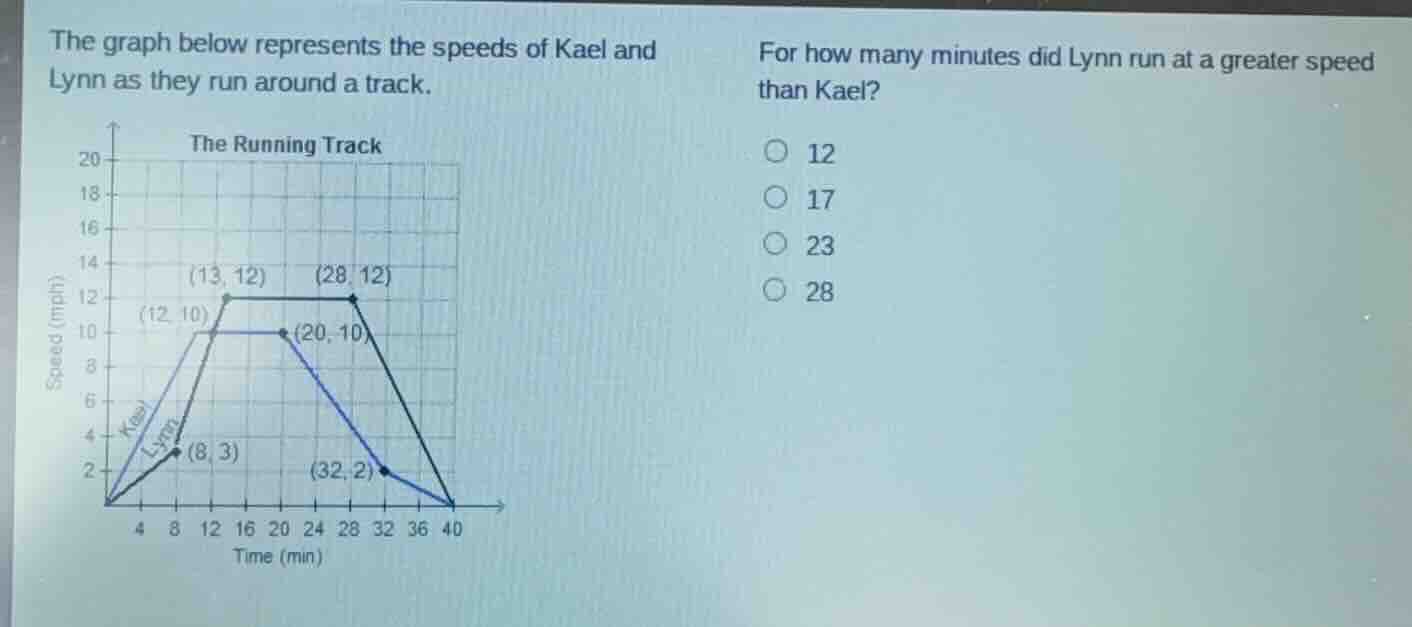
the graph below represents the speeds of kael and lynn as they run around a track.
for how many minutes did lynn run at a greater speed than kael?
12
17
23
28
Step1: Identify speed overlap intervals
First, find time ranges where Lynn's speed > Kael's speed:
- 0 to 12 minutes: Kael's speed is higher (his line is above Lynn's).
- 12 to 28 minutes: Lynn's speed is higher (her line is above Kael's).
- 28 to 40 minutes: Kael's speed is higher (his line is above Lynn's until they both hit 0).
Step2: Calculate duration of Lynn's lead
Subtract the start and end times of the interval where Lynn is faster:
$\text{Duration} = 28 - 12 = 17$

Snap & solve any problem in the app
Get step-by-step solutions on Sovi AI
Photo-based solutions with guided steps
Explore more problems and detailed explanations
17