QUESTION IMAGE
Question
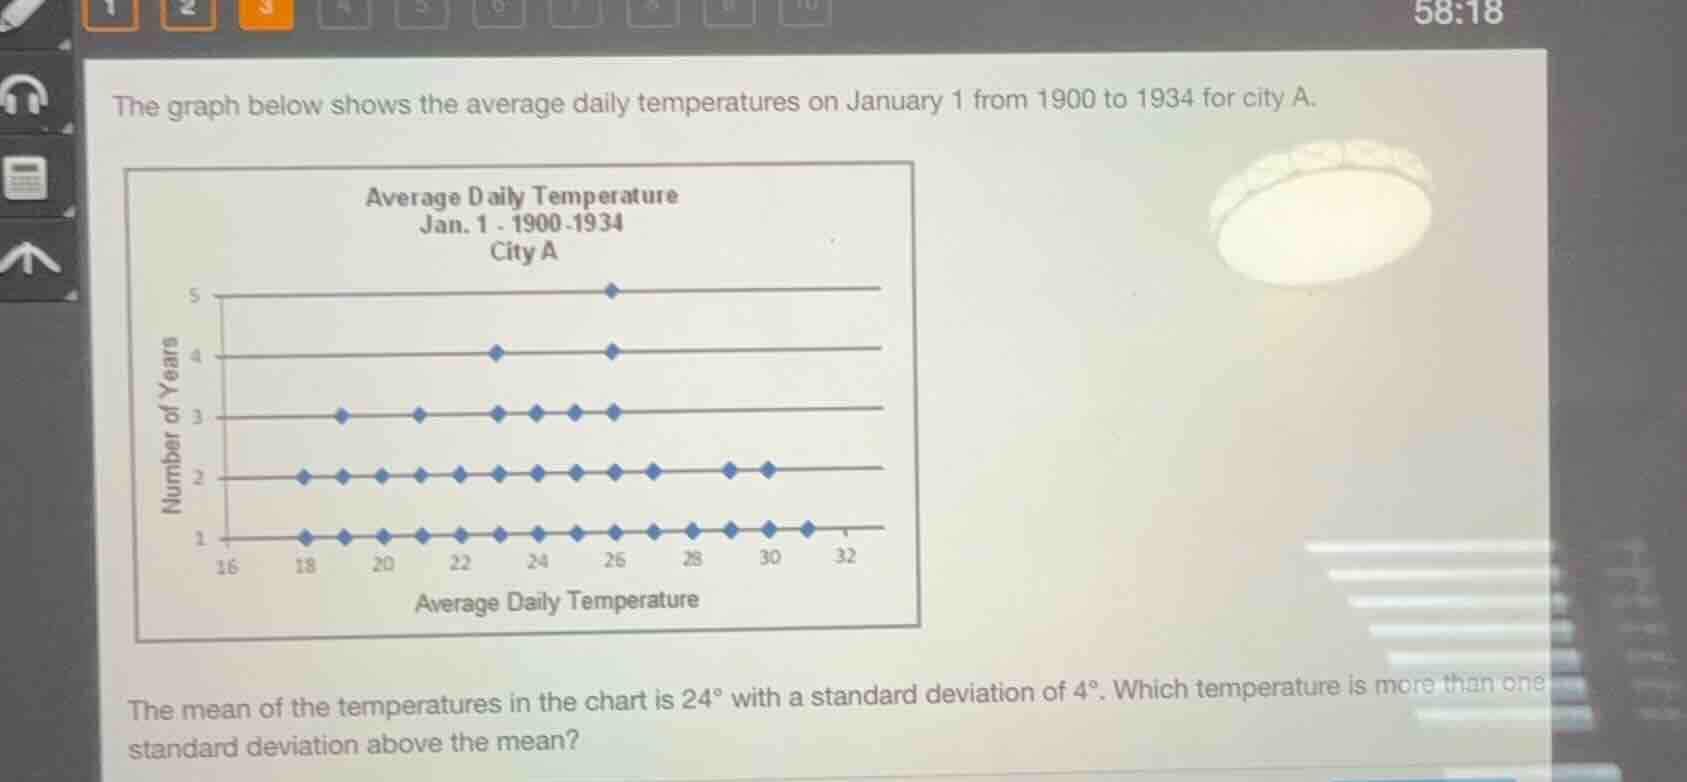
the graph below shows the average daily temperatures on january 1 from 1900 to 1934 for city a.
average daily temperature
jan. 1 - 1900-1934
city a
the mean of the temperatures in the chart is $24^\circ$ with a standard deviation of $4^\circ$. which temperature is more than one standard deviation above the mean?
Step1: Calculate threshold value
First, find the value that is one standard deviation above the mean. The formula is $\text{Mean} + 1\times\text{Standard Deviation}$.
$\text{Threshold} = 24 + 4 = 28$
Step2: Identify target temperature
We need a temperature greater than this threshold. Looking at the x-axis values, temperatures above 28 are 30 and 32, which are more than 28.

Snap & solve any problem in the app
Get step-by-step solutions on Sovi AI
Photo-based solutions with guided steps
Explore more problems and detailed explanations
Temperatures of $30^\circ$ and $32^\circ$ are more than one standard deviation above the mean.